
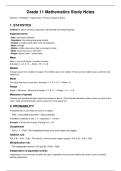
Grade 11 Mathematics Study Notes
Statistics • Probability • Trigonometry • Finance: Growth & Decay
1. STATISTICS
Statistics is about collecting, organising, representing and interpreting data.
Important terms
• Data: information collected.
• Population: the whole group being studied.
• Sample: a smaller group taken from the population.
• Mean: average.
• Median: middle value when data is arranged in order.
• Mode: value that occurs most often.
• Range: highest value − lowest value.
Mean
Mean = sum of all values ÷ number of values.
Example: 2, 4, 6, 8, 10 → Mean = 30 ÷ 5 = 6.
Median
Arrange values from smallest to largest. The middle value is the median. If there are two middle values, add them and
divide by 2.
Mode
The value that occurs most often. Example: 2, 3, 3, 4, 5, 3 → Mode = 3.
Range
Range = Maximum − Minimum. Example: 4, 7, 9, 12 → Range = 12 − 4 = 8.
Measures of spread
Variance and standard deviation show how spread out data is. Small standard deviation means values are close to the
mean; large standard deviation means values are more spread out.
2. PROBABILITY
Probability tells us how likely an event is to happen.
P(A) = favourable outcomes ÷ total outcomes
Probability is between 0 and 1: 0 = impossible, 1 = certain.
Example: A fair die has 6 sides. P(rolling a 4) = 1/6.
Complement
P(A') = 1 − P(A). The complement means the event does not happen.
Addition rule
P(A or B) = P(A) + P(B) − P(A and B). If events cannot happen together, P(A or B) = P(A) + P(B).
Multiplication rule
For independent events: P(A and B) = P(A) × P(B).
Independent vs dependent events
Independent: one event does not affect the other. Dependent: the first event affects the second, such as drawing
without replacement.
Statistics • Probability • Trigonometry • Finance: Growth & Decay
1. STATISTICS
Statistics is about collecting, organising, representing and interpreting data.
Important terms
• Data: information collected.
• Population: the whole group being studied.
• Sample: a smaller group taken from the population.
• Mean: average.
• Median: middle value when data is arranged in order.
• Mode: value that occurs most often.
• Range: highest value − lowest value.
Mean
Mean = sum of all values ÷ number of values.
Example: 2, 4, 6, 8, 10 → Mean = 30 ÷ 5 = 6.
Median
Arrange values from smallest to largest. The middle value is the median. If there are two middle values, add them and
divide by 2.
Mode
The value that occurs most often. Example: 2, 3, 3, 4, 5, 3 → Mode = 3.
Range
Range = Maximum − Minimum. Example: 4, 7, 9, 12 → Range = 12 − 4 = 8.
Measures of spread
Variance and standard deviation show how spread out data is. Small standard deviation means values are close to the
mean; large standard deviation means values are more spread out.
2. PROBABILITY
Probability tells us how likely an event is to happen.
P(A) = favourable outcomes ÷ total outcomes
Probability is between 0 and 1: 0 = impossible, 1 = certain.
Example: A fair die has 6 sides. P(rolling a 4) = 1/6.
Complement
P(A') = 1 − P(A). The complement means the event does not happen.
Addition rule
P(A or B) = P(A) + P(B) − P(A and B). If events cannot happen together, P(A or B) = P(A) + P(B).
Multiplication rule
For independent events: P(A and B) = P(A) × P(B).
Independent vs dependent events
Independent: one event does not affect the other. Dependent: the first event affects the second, such as drawing
without replacement.


