ECONOMICS
Complete Visual Study Guide
Grade 11 CAPS — South Africa
All Theory + All Graphs and Diagrams Explained Simply
📊 20 Fully Labelled Diagrams Included
,CHAPTER 1: What Is Economics?
The Core Problem: Scarcity
Economics is the study of how people, businesses, and governments make CHOICES about using LIMITED
resources to satisfy UNLIMITED wants and needs.
The Central Problem: There is never enough of everything. Resources are scarce but human wants
are unlimited. Economics studies the choices we make and the trade-offs involved.
Key Term Simple Meaning Example
Scarcity Resources are LIMITED but wants are Not enough land, money, water for
UNLIMITED everyone
Needs Things needed to survive Food, water, shelter, clothing
Wants Desired but not essential New iPhone, car, holiday
Resources Means used to produce Land, labour, capital, entrepreneurship
goods/services
Opportunity Cost What you GIVE UP when you make a Studying instead of working = lost wages
choice
The Four Factors of Production
Factor What It Is Example Reward
Land Natural resources Soil, water, minerals Rent
Labour Human work Workers, teachers, Wages
doctors
Capital Man-made tools (NOT Machines, buildings Interest
money!)
Entrepreneurship Risk-taking organiser Business owners Profit
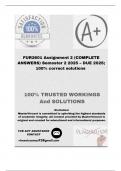
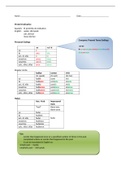
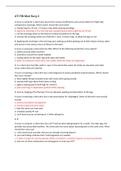
The Production Possibility Curve (PPC)
The PPC shows the MAXIMUM combinations of two goods a country can produce when using all its resources
efficiently.
, Figure 1: The Production Possibility Curve (PPC)
Point Location Meaning
A — Unattainable Outside the PPC Cannot produce this combination with current resources —
need more resources or better technology
B — Efficient On the PPC Using ALL resources fully and efficiently — no waste
C — Inefficient Inside the PPC Resources are not being fully used — unemployment or waste
exists
Opportunity Cost on the PPC: Moving along the PPC means producing more of one good but LESS of
the other. That 'less' is the opportunity cost. The PPC shows us there is no free lunch!
What causes the PPC to shift OUTWARD (economic growth)?
• Discovery of new natural resources
• Improved technology
• Growth in labour force
• Better education and skills
, CHAPTER 2: Demand
What Is Demand?
Demand is the amount of a good or service that consumers are WILLING and ABLE to buy at a given price during
a given period of time. Both willing AND able must be true.
The Law of Demand: As price INCREASES → quantity demanded DECREASES. As price DECREASES →
quantity demanded INCREASES. This is an INVERSE relationship.
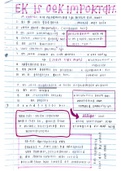
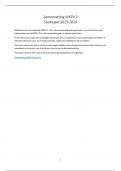
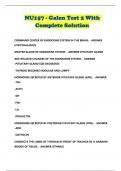
Graph 1: The Demand Curve
Figure 2: The Demand Curve — Downward Sloping
Reading the graph:
• Y-axis = Price (P)
• X-axis = Quantity demanded (Q)
• The curve slopes DOWNWARD from left to right — higher price = less quantity demanded
• A MOVEMENT along the curve happens when PRICE changes (not a shift)
Graph 2: Shifts of the Demand Curve
Complete Visual Study Guide
Grade 11 CAPS — South Africa
All Theory + All Graphs and Diagrams Explained Simply
📊 20 Fully Labelled Diagrams Included
,CHAPTER 1: What Is Economics?
The Core Problem: Scarcity
Economics is the study of how people, businesses, and governments make CHOICES about using LIMITED
resources to satisfy UNLIMITED wants and needs.
The Central Problem: There is never enough of everything. Resources are scarce but human wants
are unlimited. Economics studies the choices we make and the trade-offs involved.
Key Term Simple Meaning Example
Scarcity Resources are LIMITED but wants are Not enough land, money, water for
UNLIMITED everyone
Needs Things needed to survive Food, water, shelter, clothing
Wants Desired but not essential New iPhone, car, holiday
Resources Means used to produce Land, labour, capital, entrepreneurship
goods/services
Opportunity Cost What you GIVE UP when you make a Studying instead of working = lost wages
choice
The Four Factors of Production
Factor What It Is Example Reward
Land Natural resources Soil, water, minerals Rent
Labour Human work Workers, teachers, Wages
doctors
Capital Man-made tools (NOT Machines, buildings Interest
money!)
Entrepreneurship Risk-taking organiser Business owners Profit
The Production Possibility Curve (PPC)
The PPC shows the MAXIMUM combinations of two goods a country can produce when using all its resources
efficiently.
, Figure 1: The Production Possibility Curve (PPC)
Point Location Meaning
A — Unattainable Outside the PPC Cannot produce this combination with current resources —
need more resources or better technology
B — Efficient On the PPC Using ALL resources fully and efficiently — no waste
C — Inefficient Inside the PPC Resources are not being fully used — unemployment or waste
exists
Opportunity Cost on the PPC: Moving along the PPC means producing more of one good but LESS of
the other. That 'less' is the opportunity cost. The PPC shows us there is no free lunch!
What causes the PPC to shift OUTWARD (economic growth)?
• Discovery of new natural resources
• Improved technology
• Growth in labour force
• Better education and skills
, CHAPTER 2: Demand
What Is Demand?
Demand is the amount of a good or service that consumers are WILLING and ABLE to buy at a given price during
a given period of time. Both willing AND able must be true.
The Law of Demand: As price INCREASES → quantity demanded DECREASES. As price DECREASES →
quantity demanded INCREASES. This is an INVERSE relationship.
Graph 1: The Demand Curve
Figure 2: The Demand Curve — Downward Sloping
Reading the graph:
• Y-axis = Price (P)
• X-axis = Quantity demanded (Q)
• The curve slopes DOWNWARD from left to right — higher price = less quantity demanded
• A MOVEMENT along the curve happens when PRICE changes (not a shift)
Graph 2: Shifts of the Demand Curve