Data Analytics
HC1: Introduction to the course
Course construction
1. Basics
a. Introduction
b. Definitions & concepts
c. Data foundation
2. Data mining
a. Classification
b. Clustering & outer analysis
c. Association rules
3. Visualization
a. Human perception
b. Design of data visualization techniques
c. Visualization techniques for non-spatial data
d. Visualization techniques for temporal data
e. Visualization techniques for geo-spatial data
f. Visualization techniques for 3D Spatial data
You might be aware of is that huge amounts of data automatically connected whether you are
• Supermarket, YouTube, Netflix
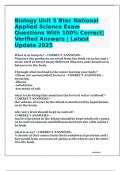
Knowledge Discovery in Databases (KDD): the process of (semi-) automatic extraction of
knowledge from databases which is
- Valid: there’s somehow a model from which I can derive this knowledge and you can prop
that model several times with the same input and it shows the same output
- Previously unknown
- And potentially useful
Interdisciplinary field:
Database systems:
• Scalability for large datasets
• Integration from different sources
• Novel data types (e.g., text)
Data statistics
• Probabilistic knowledge (certainty and uncertainty)
• Model-based inferences
• Evaluation of knowledge
Machine learning
• Different paradigms of learning
• Supervised learning
• Hypothesis spaces and search strategies
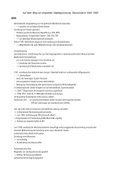
,KDD Process Model
,Hands-on-questions
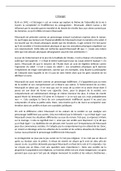
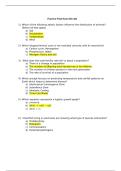
Bioinformatics: What is the data mining task?
A. Classification
B. Clustering
C. Association Rules
A: classification. You have to ask: what do you
want with this data? All answers are somehow
correct if you know what you want, and you can
argument it.
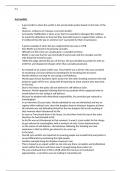
Network Security: What is the data mining task?
A. Classification
B. Clustering
C. Association Rules
B. Clustering (detection), and association rules
is also a possible solution
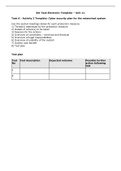
Visualization: data is coming in; you
visualize it and you gain insights
Visual analytics: computers are incredibly
fast, accurate, and stupid, humans are
incredibly slow, inaccurate, and brilliant,
together they are powerful beyond
imagination.
How to design good visualizations?
What are the goals of visualization?
Presentation
• Starting point: facts to be presented are fixed a priority
• Process: choice of appropriate presentation techniques
• Result: high-quality visualization of the data to present facts
Confirmatory Analysis
• Starting point: hypotheses about data
• Process: goal-oriented examination of the hypotheses
• Result: visualization of data to confirm or reject the hypotheses
Exploratory analysis
• Starting point: no hypotheses about the data
• Process: interactive usually undirected search for structures, trends
• Result: visualization of data to lead to hypotheses about the data
What is visualization?
• Visualization is the process of presenting data in a form that allows rapid understanding
of relationships and findings that are not readily evident frow raw data (National Center
for Statistics and Analysis)
• The use of computer-generated, interactive, visual representations of abstract data to
amplify cognition (Card, Mackinlay, Shneiderman)
, Visual Analytics
HC1: Introduction to the course
Course construction
1. Basics
a. Introduction
b. Definitions & concepts
c. Data foundation
2. Data mining
a. Classification
b. Clustering & outer analysis
c. Association rules
3. Visualization
a. Human perception
b. Design of data visualization techniques
c. Visualization techniques for non-spatial data
d. Visualization techniques for temporal data
e. Visualization techniques for geo-spatial data
f. Visualization techniques for 3D Spatial data
You might be aware of is that huge amounts of data automatically connected whether you are
• Supermarket, YouTube, Netflix
Knowledge Discovery in Databases (KDD): the process of (semi-) automatic extraction of
knowledge from databases which is
- Valid: there’s somehow a model from which I can derive this knowledge and you can prop
that model several times with the same input and it shows the same output
- Previously unknown
- And potentially useful
Interdisciplinary field:
Database systems:
• Scalability for large datasets
• Integration from different sources
• Novel data types (e.g., text)
Data statistics
• Probabilistic knowledge (certainty and uncertainty)
• Model-based inferences
• Evaluation of knowledge
Machine learning
• Different paradigms of learning
• Supervised learning
• Hypothesis spaces and search strategies
,KDD Process Model
,Hands-on-questions
Bioinformatics: What is the data mining task?
A. Classification
B. Clustering
C. Association Rules
A: classification. You have to ask: what do you
want with this data? All answers are somehow
correct if you know what you want, and you can
argument it.
Network Security: What is the data mining task?
A. Classification
B. Clustering
C. Association Rules
B. Clustering (detection), and association rules
is also a possible solution
Visualization: data is coming in; you
visualize it and you gain insights
Visual analytics: computers are incredibly
fast, accurate, and stupid, humans are
incredibly slow, inaccurate, and brilliant,
together they are powerful beyond
imagination.
How to design good visualizations?
What are the goals of visualization?
Presentation
• Starting point: facts to be presented are fixed a priority
• Process: choice of appropriate presentation techniques
• Result: high-quality visualization of the data to present facts
Confirmatory Analysis
• Starting point: hypotheses about data
• Process: goal-oriented examination of the hypotheses
• Result: visualization of data to confirm or reject the hypotheses
Exploratory analysis
• Starting point: no hypotheses about the data
• Process: interactive usually undirected search for structures, trends
• Result: visualization of data to lead to hypotheses about the data
What is visualization?
• Visualization is the process of presenting data in a form that allows rapid understanding
of relationships and findings that are not readily evident frow raw data (National Center
for Statistics and Analysis)
• The use of computer-generated, interactive, visual representations of abstract data to
amplify cognition (Card, Mackinlay, Shneiderman)
, Visual Analytics