Introduction to Practical Work and Mathematics
Uncertainties
Absolute uncertainty = the uncertainty of a measurement given as a fixed quantity.
Fractional uncertainty = uncertainty given as a fraction.
Percentage uncertainty = the uncertainty given as a percentage of the measurement.
You can decrease the uncertainty % by increasing the value of what you are
measuring.
E.g. You measure 10mm with a mm ruler and get an uncertainty of 10% but if you
measured a length of 20mm it would be an uncertainty of 5%.
The uncertainty on a mean of repeated results is equal to half the range of the
results.
Raising to a power - MULTIPLY PERCENTAGE UNCERTAINTY BY POWER
Adding or subtracting
1. Subtract the lengths without the uncertainties.
2. Then find the total uncertainty by adding the individual absolute uncertainties.
Multiplying or dividing
1. First calculate the value without the uncertainty.
2. Then calculate the percentage of all the uncertainties and add them together.
3. Then times the value without uncertainty with the percentage to find the
uncertainty.
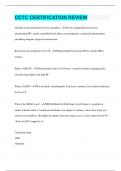
Uncertainties and graphs
Uncertainties are shown as error bars on graphs,
e.g. if the uncertainty is 5mm then have 5 squares of error bar on either side of the
point A line of best fit on a graph should go through all error bars (excluding
anomalous points).
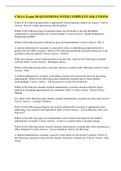
The uncertainty in a gradient can be found by lines of best and worst fit:
Or if there is a y-intercept:
Uncertainties
Absolute uncertainty = the uncertainty of a measurement given as a fixed quantity.
Fractional uncertainty = uncertainty given as a fraction.
Percentage uncertainty = the uncertainty given as a percentage of the measurement.
You can decrease the uncertainty % by increasing the value of what you are
measuring.
E.g. You measure 10mm with a mm ruler and get an uncertainty of 10% but if you
measured a length of 20mm it would be an uncertainty of 5%.
The uncertainty on a mean of repeated results is equal to half the range of the
results.
Raising to a power - MULTIPLY PERCENTAGE UNCERTAINTY BY POWER
Adding or subtracting
1. Subtract the lengths without the uncertainties.
2. Then find the total uncertainty by adding the individual absolute uncertainties.
Multiplying or dividing
1. First calculate the value without the uncertainty.
2. Then calculate the percentage of all the uncertainties and add them together.
3. Then times the value without uncertainty with the percentage to find the
uncertainty.
Uncertainties and graphs
Uncertainties are shown as error bars on graphs,
e.g. if the uncertainty is 5mm then have 5 squares of error bar on either side of the
point A line of best fit on a graph should go through all error bars (excluding
anomalous points).
The uncertainty in a gradient can be found by lines of best and worst fit:
Or if there is a y-intercept: