Theme 2 Topic 10
Break-Even
Break-Even Analysis
Break-Even – when the total revenue is equal to total costs so neither a profit nor loss is made
Break-Even Point – the number of products the business needs to sell so total revenue equals total costs
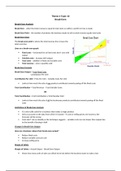
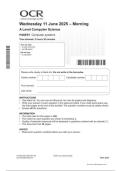
Break-Even Chart
The break-even point is where the total revenue line crosses the
total costs line
Lines on a break-even graph:
Fixed costs – horizontal line as fixed costs don’t vary with
output
Variable costs – increase with output
Total costs – addition of fixed and variable costs
Total revenue – price x quantity sold
Break-Even Formula
Break-Even Output = Total Fixed Costs
Contribution Per Unit
Contribution Per Unit = Price Per Unit – Variable Costs Per Unit
Looks at how much the sale of one product contributes towards paying off the fixed costs
Total Contribution = Total Revenue – Total Variable Costs
OR
Total Contribution = Unit Contribution x Total Number Sold
Looks at how much the sale of all the businesses products contributes towards paying off the fixed
costs
Limitations of Break-Even Analysis
It’s only really useful for a business that makes a single product
Only as accurate as the data from which it is based – if costs or selling prices are incorrect, the
forecasts will be wrong
Costs don’t rise as steadily as the technique suggests – variable costs can rise slower than output due
to the benefit of buying in bulk
Changes in Break-Even Output
How can a business reduce their break-even output?
Reduce fixed costs
Reduce variable costs per unit
Increase selling price
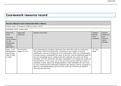
Margin of Safety
Margin of Safety = Actual Output – Break-Even Output
Shows how many units of sales can afford to be lost before the business starts to make a loss
Break-Even
Break-Even Analysis
Break-Even – when the total revenue is equal to total costs so neither a profit nor loss is made
Break-Even Point – the number of products the business needs to sell so total revenue equals total costs
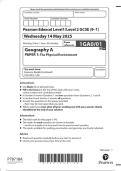
Break-Even Chart
The break-even point is where the total revenue line crosses the
total costs line
Lines on a break-even graph:
Fixed costs – horizontal line as fixed costs don’t vary with
output
Variable costs – increase with output
Total costs – addition of fixed and variable costs
Total revenue – price x quantity sold
Break-Even Formula
Break-Even Output = Total Fixed Costs
Contribution Per Unit
Contribution Per Unit = Price Per Unit – Variable Costs Per Unit
Looks at how much the sale of one product contributes towards paying off the fixed costs
Total Contribution = Total Revenue – Total Variable Costs
OR
Total Contribution = Unit Contribution x Total Number Sold
Looks at how much the sale of all the businesses products contributes towards paying off the fixed
costs
Limitations of Break-Even Analysis
It’s only really useful for a business that makes a single product
Only as accurate as the data from which it is based – if costs or selling prices are incorrect, the
forecasts will be wrong
Costs don’t rise as steadily as the technique suggests – variable costs can rise slower than output due
to the benefit of buying in bulk
Changes in Break-Even Output
How can a business reduce their break-even output?
Reduce fixed costs
Reduce variable costs per unit
Increase selling price
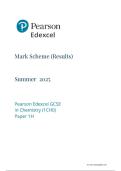
Margin of Safety
Margin of Safety = Actual Output – Break-Even Output
Shows how many units of sales can afford to be lost before the business starts to make a loss