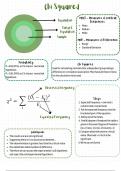
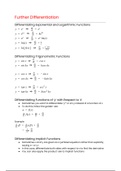
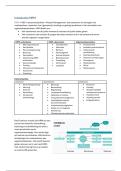
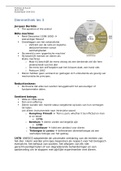
Chi Squared
MOCT - Measures of Central
Population Tendencies:
Mean
Target Median
Population Mode
Sample
MOD - Measures of Difference:
Range
Standard Deviation
Probability:
Chi Squared:
P = 0.05 (95%) so 5% chance - two tailed
Used for calculating nominal data, independent groups design,
hypothesis
difference or correlation/association. Must have all these criteria
P = O.01 (99%) so 1% chance - one tailed
for the calculation to be used.
hypothesis
Observed frequency
Steps:
1. Expected frequency = row total x
column total/ overall total
2. Put the expected frequency into the
bracketed part of the equation .
Expected Frequency 3. Add up all of the totals .
4. Find N (degree of freedom) the table is
given in the exam. Degree of freedom =
(no. of rows - 1) x (no. of columns -1)
Conclusion: 5.Compare observed value to critical
The results are/are not significant value. Observed > critical to be
Suggesting there is/is no association between ... significant.
The observed value is greater/less than the critical value 6.Write up conclusion
One tailed/two tailed number of difference
Therefore we can accept the experimental/ null hypothesis
and reject the null/experimental hypothesis