The Distribution of Income and Wealth (Poverty and Inequality)
Factors which influence the distribution of income and wealth
• Income + wealth always unequally distributed in UK. Even when economic growth creates full employment, incomes rich tend
increase faster than those of poor. For this reason, fast economic growth may actually widen income differences, though those
at the bottom may end up absolutely better off.
• 2018: top 5th UK households received 40% total household income; bottom 5th received only 8%. Data relates to income after
taxes deducted + welfare benefits received. Large no. factors influence distribution income.
• Factors production: distribution national income between different factors production. Owners large land holdings such as
country estates receive large incomes form rent. Puts landowners in top income quintile. National income landlords and
owners capital grown, whereas labour’s share fallen.
• Share national income paid to workers falling since 1980. Chapter 3 of the April 2017 edition of the World Economic Outlook
published by the IMF finds this trend driven by rapid progress technology + global integration.
• Across world, labour’s share worldwide income 63% early 2000’s, down from over 66% in early 1990s. One reason that wages
haven’t been rising proportionately to productivity, hence share national income fallen.
• Many owners’ capital, including entrepreneurs, receive income form dividend payments via shares. Profits/entrepreneurial
incomes risen at expense wages/salaries, whereas salaries CEO’s grown much faster than wages.
• Distinction between earned and unearned income: wages, salaries vs interest, investment income, dividends. Various
determinants wages used to explain differences in earned incomes.
• Contrast, differences in unearned income depend primarily on inequalities in distribution wealth.
• Wages and salary differentials: within labour market, difference between wages/salaries top vs bottom widened. Can be
highlighted by supply and demand theory for high earners (inelastic supply/demand) vs low earners (elastic demand supply).
Main factors contributing difference hourly wage rates: differences in labour productivity (determining relative positions
demand curves) different slopes supply curves.
• Globalisation and international migration workers: contributed to widened differences between wages and salaries paid to
different groups workers. In UK, low-paid workers in competition migrants poorer areas world, + overseas-based workers
employed in developing countries (outsourcing UK jobs – earning much lower wages).
• Inequality in the distribution of wealth: distribution of wealth significantly much more unequal then distribution income.
According to the Resolution Foundation (UK think tank ai improve standard living poor), spreading property wealth across UK in
mid-1990’s and mid-2000’s contributed decade-long fall in wealth inequality. Trend reversed.
• UK’s record £11.1trillion wealth 2014 distributed far less equally than earnings/household income. Currently, 1/10 adults own
around half nation’s wealth, with top 1% owning 14% UK wealth. By contrast, 15% adults holding no wealth.
• ONS defines total net wealth as sum 4 components: net property wealth, physical wealth, net financial wealth + private pension
wealth.
Factors influencing distribution wealth
• Ability benefit capital gains
• Private pension assets
• Inheritance, gifts and luck
• Wealth taxation versus taxation income
Horizontal and vertical equity
• Government intervention in the economy, treats people in same circumstances equally, obeys principle horizontal equity.
Occurs when households with same income/personal circumstances pay same income tax/eligible same welfare benefits.
• Vertical equity much more controversial, justifies taking income from rich and redistributing to poor.
• Distribution income after taxation + receipt transfers (redistributed income) judged by many more equitable than gross income
distribution.
• However, achieving greater vertical equity conflict another principle intervention: benefit principle.
• Benefit principle: argues those who receive most benefit from government spending should pay the most taxes (for example
motorists benefitting from roads.
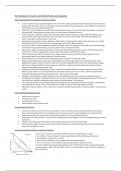
Lorenz Curve and Gini Coefficient as measures of inequality
• Lorenz curve: measures extent which distribution income or wealth equal or unequal.
• Gini coefficient: measures degree inequality as per deviation from perfectly equal distribution.
• Gini Coefficient = area A/ area A + area B
• Lower value Gini coefficient, more equally household income distributed.
• Lorenz curves closer to line complete equality represent greater equality, vice-versa.
• The Gini-coefficient for equivalised disposable income UK 1977-2015 revealed inequality of disposable
income increased in 1980’s, fell early 1990’s. Fell from around 36% 2001 to under 32% 2015. Inequality at
lowest for 30 years.
Factors which influence the distribution of income and wealth
• Income + wealth always unequally distributed in UK. Even when economic growth creates full employment, incomes rich tend
increase faster than those of poor. For this reason, fast economic growth may actually widen income differences, though those
at the bottom may end up absolutely better off.
• 2018: top 5th UK households received 40% total household income; bottom 5th received only 8%. Data relates to income after
taxes deducted + welfare benefits received. Large no. factors influence distribution income.
• Factors production: distribution national income between different factors production. Owners large land holdings such as
country estates receive large incomes form rent. Puts landowners in top income quintile. National income landlords and
owners capital grown, whereas labour’s share fallen.
• Share national income paid to workers falling since 1980. Chapter 3 of the April 2017 edition of the World Economic Outlook
published by the IMF finds this trend driven by rapid progress technology + global integration.
• Across world, labour’s share worldwide income 63% early 2000’s, down from over 66% in early 1990s. One reason that wages
haven’t been rising proportionately to productivity, hence share national income fallen.
• Many owners’ capital, including entrepreneurs, receive income form dividend payments via shares. Profits/entrepreneurial
incomes risen at expense wages/salaries, whereas salaries CEO’s grown much faster than wages.
• Distinction between earned and unearned income: wages, salaries vs interest, investment income, dividends. Various
determinants wages used to explain differences in earned incomes.
• Contrast, differences in unearned income depend primarily on inequalities in distribution wealth.
• Wages and salary differentials: within labour market, difference between wages/salaries top vs bottom widened. Can be
highlighted by supply and demand theory for high earners (inelastic supply/demand) vs low earners (elastic demand supply).
Main factors contributing difference hourly wage rates: differences in labour productivity (determining relative positions
demand curves) different slopes supply curves.
• Globalisation and international migration workers: contributed to widened differences between wages and salaries paid to
different groups workers. In UK, low-paid workers in competition migrants poorer areas world, + overseas-based workers
employed in developing countries (outsourcing UK jobs – earning much lower wages).
• Inequality in the distribution of wealth: distribution of wealth significantly much more unequal then distribution income.
According to the Resolution Foundation (UK think tank ai improve standard living poor), spreading property wealth across UK in
mid-1990’s and mid-2000’s contributed decade-long fall in wealth inequality. Trend reversed.
• UK’s record £11.1trillion wealth 2014 distributed far less equally than earnings/household income. Currently, 1/10 adults own
around half nation’s wealth, with top 1% owning 14% UK wealth. By contrast, 15% adults holding no wealth.
• ONS defines total net wealth as sum 4 components: net property wealth, physical wealth, net financial wealth + private pension
wealth.
Factors influencing distribution wealth
• Ability benefit capital gains
• Private pension assets
• Inheritance, gifts and luck
• Wealth taxation versus taxation income
Horizontal and vertical equity
• Government intervention in the economy, treats people in same circumstances equally, obeys principle horizontal equity.
Occurs when households with same income/personal circumstances pay same income tax/eligible same welfare benefits.
• Vertical equity much more controversial, justifies taking income from rich and redistributing to poor.
• Distribution income after taxation + receipt transfers (redistributed income) judged by many more equitable than gross income
distribution.
• However, achieving greater vertical equity conflict another principle intervention: benefit principle.
• Benefit principle: argues those who receive most benefit from government spending should pay the most taxes (for example
motorists benefitting from roads.
Lorenz Curve and Gini Coefficient as measures of inequality
• Lorenz curve: measures extent which distribution income or wealth equal or unequal.
• Gini coefficient: measures degree inequality as per deviation from perfectly equal distribution.
• Gini Coefficient = area A/ area A + area B
• Lower value Gini coefficient, more equally household income distributed.
• Lorenz curves closer to line complete equality represent greater equality, vice-versa.
• The Gini-coefficient for equivalised disposable income UK 1977-2015 revealed inequality of disposable
income increased in 1980’s, fell early 1990’s. Fell from around 36% 2001 to under 32% 2015. Inequality at
lowest for 30 years.