EQ1 Diverse Places 27.5.19
EQ1: how do population structures vary?
Population structure
UKs population unevenly distributed and changes at different rates depending on
location.
Hoddor student guide:
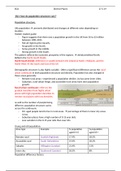
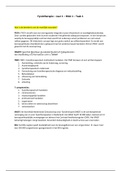
- Figure suggests that there was a population growth in the UK from 56 to 63 million
between 1981-2011.
- Not all regions grew equally.
- No growth in the North.
- Some growth in the middle.
- Strong growth in the South.
The pattern reflects the economic prosperity of the regions. deindustrialised North.
Reflects the North-South Divide.
North-South Divide: difference in wealth between the industrial North, Midlands, and the
North-West VS the South and East of the UK
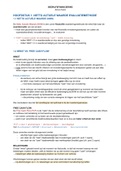
Demographic structure is also highly variable. Often a significant difference across the rural-
urban continuum in both population structure and density. Population has also changed in
these areas generally:
- Remote rural areas = experienced a population decline. As has some inner cities.
- Suburban, rural-urban fringe, and accessible rural areas have seen population
growth.
Rural-urban continuum: refers to the
gradual transition from highly urban
places with high population densities to
remote rural places with low densities.
as well as the number of people being
different, population structure varies
across the continuum:
- 65+ aged people tend to live in rural areas. percentage of them in inner city areas
is low.
- Suburban places have a high number of 0-15 year olds.
- Less variation in the 0-15 year olds than over 65s.
Young and old population:
Area type Example % population % population
aged 0-15 aged 65+
Remote rural Scottish Highlands 17.9% 18.5%
Accessible rural South Oxfordshire 19.4% 18.2%
Suburbs Hillingdon (London) 21.4% 11%
Inner city Southwark (London) 18.5% 8%
Population difference factors:
EQ1: how do population structures vary?
Population structure
UKs population unevenly distributed and changes at different rates depending on
location.
Hoddor student guide:
- Figure suggests that there was a population growth in the UK from 56 to 63 million
between 1981-2011.
- Not all regions grew equally.
- No growth in the North.
- Some growth in the middle.
- Strong growth in the South.
The pattern reflects the economic prosperity of the regions. deindustrialised North.
Reflects the North-South Divide.
North-South Divide: difference in wealth between the industrial North, Midlands, and the
North-West VS the South and East of the UK
Demographic structure is also highly variable. Often a significant difference across the rural-
urban continuum in both population structure and density. Population has also changed in
these areas generally:
- Remote rural areas = experienced a population decline. As has some inner cities.
- Suburban, rural-urban fringe, and accessible rural areas have seen population
growth.
Rural-urban continuum: refers to the
gradual transition from highly urban
places with high population densities to
remote rural places with low densities.
as well as the number of people being
different, population structure varies
across the continuum:
- 65+ aged people tend to live in rural areas. percentage of them in inner city areas
is low.
- Suburban places have a high number of 0-15 year olds.
- Less variation in the 0-15 year olds than over 65s.
Young and old population:
Area type Example % population % population
aged 0-15 aged 65+
Remote rural Scottish Highlands 17.9% 18.5%
Accessible rural South Oxfordshire 19.4% 18.2%
Suburbs Hillingdon (London) 21.4% 11%
Inner city Southwark (London) 18.5% 8%
Population difference factors: