
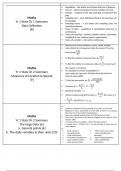
Population – the whole set of items that are of interest.
Census – observes/measures every member of a pop.
Sample – a subset of the pop intended to represent the
pop.
Maths Sampling unit – each individual thing in the pop that can
Yr 1 Stats Ch 1 Summary be sampled.
Sampling frame – a list where the sampling units are
Data Collection named/numbered.
[8] Types of data – qualitative & quantitative (discreet vs
continuous).
Types of sampling – random (simple random, systematic,
stratified) & non-random (quota, opportunity).
Types of variables – discreet & continuous.
Measures of central tendency: mean, mode, median.
Given data from a frequency table, the mean ( x ) can be
Σ fx
found using
Σf
n+1
To find the median in discreet data, do
2
n
To find the median in continuous data, do & round up if
2
Maths the number is a fraction.
The equation for linear interpolation is:
Yr 1 Stats Ch 2 Summary start value of interval+ (fraction along the interval x
Measures of Location & Spread interval value width)
percentile
[9] To find the percentile, do Σf x
100
Σf x 2
Sxx
Variance (σ 2) = - x2 =
n n
Standard variation = σ
x−a
If data is coded using the formula y = , the mean is y
b
x−a
= ∧the SD is σ y = σ x /b
b
a)
Camborne, Heathrow, Hurn, Leeming, & Leuchars are in the UK.
Beijing is in china, Jacksonville is in the USA, & Perth is in Australia
(the only one in the southern hemisphere).
Data was recorded between May -Oct 1987 & May act 2015
Maths There was a hurricane in the South of England on the night of 15/16
Yr 1 Stats Ch 2 Summary
October 1987.
n/a means data not available – ignore this piece of data.
The large Data Set tr means trace, < 0.05mm rain - can be assumed to equal zero for
most analysis.
a. General points [6] b)
- Mean temp (°c) - Mean cloud cover (octas)
b. The daily variables & their units [10] - Max gust (Knots) - Mean wind direction
- Total rainfall (mm) (bearings)
- Max relative humidity (%) - Mean windspeed (knots)
- Total sunshine (½10hr) - Mean visibility (Dm –
- Mean pressure (hPa) decametres)
Census – observes/measures every member of a pop.
Sample – a subset of the pop intended to represent the
pop.
Maths Sampling unit – each individual thing in the pop that can
Yr 1 Stats Ch 1 Summary be sampled.
Sampling frame – a list where the sampling units are
Data Collection named/numbered.
[8] Types of data – qualitative & quantitative (discreet vs
continuous).
Types of sampling – random (simple random, systematic,
stratified) & non-random (quota, opportunity).
Types of variables – discreet & continuous.
Measures of central tendency: mean, mode, median.
Given data from a frequency table, the mean ( x ) can be
Σ fx
found using
Σf
n+1
To find the median in discreet data, do
2
n
To find the median in continuous data, do & round up if
2
Maths the number is a fraction.
The equation for linear interpolation is:
Yr 1 Stats Ch 2 Summary start value of interval+ (fraction along the interval x
Measures of Location & Spread interval value width)
percentile
[9] To find the percentile, do Σf x
100
Σf x 2
Sxx
Variance (σ 2) = - x2 =
n n
Standard variation = σ
x−a
If data is coded using the formula y = , the mean is y
b
x−a
= ∧the SD is σ y = σ x /b
b
a)
Camborne, Heathrow, Hurn, Leeming, & Leuchars are in the UK.
Beijing is in china, Jacksonville is in the USA, & Perth is in Australia
(the only one in the southern hemisphere).
Data was recorded between May -Oct 1987 & May act 2015
Maths There was a hurricane in the South of England on the night of 15/16
Yr 1 Stats Ch 2 Summary
October 1987.
n/a means data not available – ignore this piece of data.
The large Data Set tr means trace, < 0.05mm rain - can be assumed to equal zero for
most analysis.
a. General points [6] b)
- Mean temp (°c) - Mean cloud cover (octas)
b. The daily variables & their units [10] - Max gust (Knots) - Mean wind direction
- Total rainfall (mm) (bearings)
- Max relative humidity (%) - Mean windspeed (knots)
- Total sunshine (½10hr) - Mean visibility (Dm –
- Mean pressure (hPa) decametres)


