Sam
Adams
ES187
-‐
Introduction
to
Engineering
Business
Management
02
-‐
Market
&
Industry
1. Economics
Strategic
managers
look
outwards
to
scan
the
environment
for
potential
environments.
Economists
look
inwards
to
create
profit
maximisation.
Key
concepts
•
– Scarcity
-‐>
leading
to
choice
and
opportunity
cost
• Scarcity
is
different
to
poverty,
however
rich
you
are,
something
will
be
in
scarce
supply.
• With
scarcity
we
have
to
choose
from
the
available
alternatives.
– Marginal
analysis
• Evaluating
the
marginal
or
incremental
benefits
and
costs
associated
with
manufacturing
one
more
unit
or
product.
• This
is
often
a
choice
between
manufacturing
two
alternative
products
assuming
that
we
are
already
using
all
capacity
and
therefore
to
make
product.
– Substitution
and
incentives
• Every
activity
has
a
substitute
and
so
if
the
opportunity
cost
of
an
activity
declines
it
will
be
easier
to
consider
substitute
activities.
•
An
incentive
can
be
in
the
form
of
higher
fuel
and
road
tax,
or
an
inducement
could
be
offered
such
as
cheaper
public
transport.
• Assumptions:
– Rational
behaviour,
most
good
for
least
cost
– An
individual
firm
has
no
influence
over
the
market
MARKET
&
INDUSTRY
• A
Market
is
made
up
of
a
group
of
products
considered
by
buyers
to
be
close
substitutes.
• An
Industry
encompasses
products
that
are
close
substitutes
from
the
supplier’s
viewpoint,
in
terms
of
inputs,
employee
skills
and
production
processes.
New
entry
to
a
market
is
most
likely
to
come
from
established
firms
closely
related
on
the
production
side
but
not
necessarily.
When
considering
prices
and
output
levels
the
market
is
the
more
relevant
concept.
• Markets
are
distinct
from
one
another
when
the
change
in
price
or
specification
in
one
product
has
no
impact
on
the
demand
for
firms
in
another
market.
• If
the
opposite
is
said
to
be
true
then
the
change
in
price
or
specification
has
a
large
impact
then
the
products
are
said
to
be
homogeneous.
Markets
can
also
be
separated
by
geography
but
international
trade
and
improved
information
&
distribution
is
reducing
the
importance
of
geography.
1
,Sam
Adams
ES187
-‐
Introduction
to
Engineering
Business
Management
2. Competition
PERFECT
COMPETITION
(ASSUMPTIONS)
• A
large
number
of
small
firms
and
consumers
• No
firm
has
any
market
power
and
no
consumer
can
influence
price
• All
firms
produce
exactly
the
same
product
• Firms
are
owned
and
managed
by
individual
entrepreneurs
• Decision
makers
are
unboundedly
rational
and
perfectly
informed
• Owners
seek
to
maximise
profits
• Consumers
seek
to
maximise
utility
TYPES
OF
COMPETITION
Perfect Imperfect
Monopoly
Competition Competition
Monopolistic Oligopoly
Competition
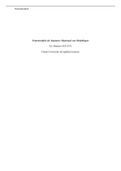
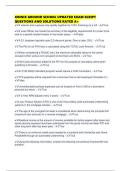
In
general
as
we
move
towards
a
Monopoly:
The
ability
to
make
supernormal
profits
increases
>
prices
faced
by
consumers
increase
>
less
incentive
for
cost
efficiencies/innovation
>
economic
efficiency
declines
Oligopoly
–
The
market
is
dominated
by
a
small
number
of
sellers.
Monopolistically
Competitive
markets
have
the
following
characteristics:
• There
are
many
producers
and
many
consumers
in
a
given
market.
• Consumers
perceive
that
there
are
non-‐price
differences
among
the
competitors'
products.
• There
are
few
barriers
to
entry
and
exit.
• Producers
have
a
degree
of
control
over
price
Therefore,
in
theory
monopoly
is
bad
for
the
economy.
Privatisation
of
state
owned
business
with
monopolies
is
assumed
economically
inefficient.
2
, Sam
Adams
ES187
-‐
Introduction
to
Engineering
Business
Management
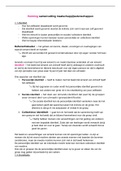
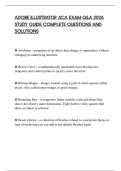
3. Supply
&
Demand
Curves
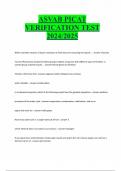
Price, P
Supply, S
P0
Demand, D
Q0 Quantity, Q
Demand:
The
Quantity
of
a
product
that
consumers
are
willing
and
able
to
buy
at
a
specific
Price
over
a
given
period
of
time.
Supply: The
Quantity
of
a
product
that
producers
are
willing
and
able
to
make
available
to
the
market
at
a
specific
Price
over
a
given
period
of
time.
Law
of
Supply
&
Demand
determines
Market
Clearing
Price
–
which
is
then
taken
by
each
company.
To
maximise
profits,
a
company
much
match
the
market-‐clearing
price.
TERMINOLOGY
• Costs:
– Total Fixed Costs (TFC): Costs that do not vary with output, Q.
– Total Variable Costs (TVC): Costs that do vary with output Q.
– Total Cost (TC): The sum of fixed and variable costs.
TC = TVC + TFC
– Average Costs (AC): The cost per unit of production. AC = TC / Q
– Marginal Costs (MC): The extra cost of producing one more unit
(per time period) MC = ΔTC / ΔQ
• Revenue:
– Total Revenue (TR): The total earnings per period of time from
the sale of output Q. TR = P x Q
– Average Revenue (AR): The amount the firm earns per unit sold.
AR = TR / Q (= Price, P)
– Marginal Revenue (MR): The extra TR gained by selling one more
unit (per time period). MR = ΔTR / ΔQ
PROFIT
MAXIMISATION
The
total
Costs
curve
is
a
little
more
complicated
as
they
are
made
up
of
fixed
costs
and
variable
costs.
Profit = Total Revenue − Total Costs
3
Adams
ES187
-‐
Introduction
to
Engineering
Business
Management
02
-‐
Market
&
Industry
1. Economics
Strategic
managers
look
outwards
to
scan
the
environment
for
potential
environments.
Economists
look
inwards
to
create
profit
maximisation.
Key
concepts
•
– Scarcity
-‐>
leading
to
choice
and
opportunity
cost
• Scarcity
is
different
to
poverty,
however
rich
you
are,
something
will
be
in
scarce
supply.
• With
scarcity
we
have
to
choose
from
the
available
alternatives.
– Marginal
analysis
• Evaluating
the
marginal
or
incremental
benefits
and
costs
associated
with
manufacturing
one
more
unit
or
product.
• This
is
often
a
choice
between
manufacturing
two
alternative
products
assuming
that
we
are
already
using
all
capacity
and
therefore
to
make
product.
– Substitution
and
incentives
• Every
activity
has
a
substitute
and
so
if
the
opportunity
cost
of
an
activity
declines
it
will
be
easier
to
consider
substitute
activities.
•
An
incentive
can
be
in
the
form
of
higher
fuel
and
road
tax,
or
an
inducement
could
be
offered
such
as
cheaper
public
transport.
• Assumptions:
– Rational
behaviour,
most
good
for
least
cost
– An
individual
firm
has
no
influence
over
the
market
MARKET
&
INDUSTRY
• A
Market
is
made
up
of
a
group
of
products
considered
by
buyers
to
be
close
substitutes.
• An
Industry
encompasses
products
that
are
close
substitutes
from
the
supplier’s
viewpoint,
in
terms
of
inputs,
employee
skills
and
production
processes.
New
entry
to
a
market
is
most
likely
to
come
from
established
firms
closely
related
on
the
production
side
but
not
necessarily.
When
considering
prices
and
output
levels
the
market
is
the
more
relevant
concept.
• Markets
are
distinct
from
one
another
when
the
change
in
price
or
specification
in
one
product
has
no
impact
on
the
demand
for
firms
in
another
market.
• If
the
opposite
is
said
to
be
true
then
the
change
in
price
or
specification
has
a
large
impact
then
the
products
are
said
to
be
homogeneous.
Markets
can
also
be
separated
by
geography
but
international
trade
and
improved
information
&
distribution
is
reducing
the
importance
of
geography.
1
,Sam
Adams
ES187
-‐
Introduction
to
Engineering
Business
Management
2. Competition
PERFECT
COMPETITION
(ASSUMPTIONS)
• A
large
number
of
small
firms
and
consumers
• No
firm
has
any
market
power
and
no
consumer
can
influence
price
• All
firms
produce
exactly
the
same
product
• Firms
are
owned
and
managed
by
individual
entrepreneurs
• Decision
makers
are
unboundedly
rational
and
perfectly
informed
• Owners
seek
to
maximise
profits
• Consumers
seek
to
maximise
utility
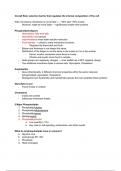
TYPES
OF
COMPETITION
Perfect Imperfect
Monopoly
Competition Competition
Monopolistic Oligopoly
Competition
In
general
as
we
move
towards
a
Monopoly:
The
ability
to
make
supernormal
profits
increases
>
prices
faced
by
consumers
increase
>
less
incentive
for
cost
efficiencies/innovation
>
economic
efficiency
declines
Oligopoly
–
The
market
is
dominated
by
a
small
number
of
sellers.
Monopolistically
Competitive
markets
have
the
following
characteristics:
• There
are
many
producers
and
many
consumers
in
a
given
market.
• Consumers
perceive
that
there
are
non-‐price
differences
among
the
competitors'
products.
• There
are
few
barriers
to
entry
and
exit.
• Producers
have
a
degree
of
control
over
price
Therefore,
in
theory
monopoly
is
bad
for
the
economy.
Privatisation
of
state
owned
business
with
monopolies
is
assumed
economically
inefficient.
2
, Sam
Adams
ES187
-‐
Introduction
to
Engineering
Business
Management
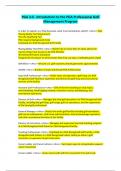
3. Supply
&
Demand
Curves
Price, P
Supply, S
P0
Demand, D
Q0 Quantity, Q
Demand:
The
Quantity
of
a
product
that
consumers
are
willing
and
able
to
buy
at
a
specific
Price
over
a
given
period
of
time.
Supply: The
Quantity
of
a
product
that
producers
are
willing
and
able
to
make
available
to
the
market
at
a
specific
Price
over
a
given
period
of
time.
Law
of
Supply
&
Demand
determines
Market
Clearing
Price
–
which
is
then
taken
by
each
company.
To
maximise
profits,
a
company
much
match
the
market-‐clearing
price.
TERMINOLOGY
• Costs:
– Total Fixed Costs (TFC): Costs that do not vary with output, Q.
– Total Variable Costs (TVC): Costs that do vary with output Q.
– Total Cost (TC): The sum of fixed and variable costs.
TC = TVC + TFC
– Average Costs (AC): The cost per unit of production. AC = TC / Q
– Marginal Costs (MC): The extra cost of producing one more unit
(per time period) MC = ΔTC / ΔQ
• Revenue:
– Total Revenue (TR): The total earnings per period of time from
the sale of output Q. TR = P x Q
– Average Revenue (AR): The amount the firm earns per unit sold.
AR = TR / Q (= Price, P)
– Marginal Revenue (MR): The extra TR gained by selling one more
unit (per time period). MR = ΔTR / ΔQ
PROFIT
MAXIMISATION
The
total
Costs
curve
is
a
little
more
complicated
as
they
are
made
up
of
fixed
costs
and
variable
costs.
Profit = Total Revenue − Total Costs
3