AQA GCSE STATISTICS 8382/1H
HIGHER TIER PAPER 1 EXAM
QUESTION PAPER
H
(AUTHENTIC MARKING SCHEME ATTACHED)
GCSE
STATISTICS
Higher tier Paper 1
Time allowed: 1 hour 45 minutes
Materials For Examiner’s Use
For this paper you must have:
Question Mark
• a copy of the Data Sheet
• a calculator 1-4
• mathematical instruments. 5
6
Instructions
7
• Use black ink or black ball-point pen. Draw diagrams in pencil.
• Fill in the boxes at the top of this page. 8
• Answer all questions. 9
• You must answer the questions in the spaces provided. Do not write 10
outside the box around each page or on blank pages.
11
• If you need extra space for your answer(s), use the lined pages at the end of
this book. Write the question number against your answer(s). 12
• Do all rough work in this book. Cross out any work you do not want 13
to be marked. 14
Information 15
• The marks for questions are shown in brackets. TOTAL
• The maximum mark for this paper is 80.
• You may ask for more answer paper and graph paper. These must be
tagged securely to this answer booklet.
*JUN2283821H01*
IB/G/Jun22/E11 8382/1H
, 2
Do not write
outside the
Answer all questions in the spaces provided. box
1 Two variables have no correlation.
Which of these could be the value of the Spearman’s Rank Correlation
Coefficient between the two variables?
Circle your answer.
[1 mark]
1 –1 0.05 0.5
2 In quality assurance sampling applications, which measure is not used for the
completion of a quality control chart?
Circle your answer.
[1 mark]
mean skew range median
3 A bag contains only 8 red balls and 5 blue balls.
A ball is taken out at random and not replaced.
A second ball is taken out at random.
If the first ball is blue, what is the probability the second ball is also blue?
Circle your answer.
[1 mark]
1 5 5 4
3 39 12 13
4 Which of these is not a method of sampling, but is a procedure of categorisation
which may be used before sampling takes place?
Circle your answer.
[1 mark]
stratification systematic quota random
4
*02*
IB/G/Jun22/8382/1H
, 3
Do not write
outside the
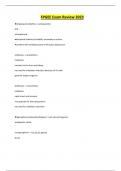
5 The graph shows the percentage pass rate for UK driving tests at different ages. box
Source: PassMeFast
5 (a) Estimate the percentage chance that a 34-year-old will pass their test.
[1 mark]
Answer %
5 (b) Betty says that the older you are the less likely you are to pass your test.
Evaluate Betty’s statement, giving evidence both for and against.
[2 marks]
For
Against
3
Turn over ►
*03*
IB/G/Jun22/8382/1H
, 4
Do not write
outside the
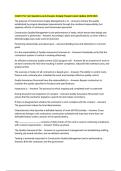
6 Luton is an industrial town. box
The population pyramid shows the number of males living in Luton in
1851. The population values are rounded to the nearest hundred.
Source: Adapted from visionofbritain
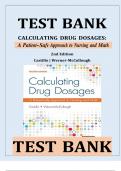
The table shows the number of females living in Luton in 1851.
Population
Age group (to nearest hundred)
0 to 9 3200
10 to 19 3300
20 to 29 3000
30 to 39 1800
40 to 49 1100
50 to 59 800
60 to 69 500
70 + 300
6 (a) Complete the population pyramid to show the number of females living in Luton in 1851.
[3 marks]
*04*
IB/G/Jun22/8382/1H
HIGHER TIER PAPER 1 EXAM
QUESTION PAPER
H
(AUTHENTIC MARKING SCHEME ATTACHED)
GCSE
STATISTICS
Higher tier Paper 1
Time allowed: 1 hour 45 minutes
Materials For Examiner’s Use
For this paper you must have:
Question Mark
• a copy of the Data Sheet
• a calculator 1-4
• mathematical instruments. 5
6
Instructions
7
• Use black ink or black ball-point pen. Draw diagrams in pencil.
• Fill in the boxes at the top of this page. 8
• Answer all questions. 9
• You must answer the questions in the spaces provided. Do not write 10
outside the box around each page or on blank pages.
11
• If you need extra space for your answer(s), use the lined pages at the end of
this book. Write the question number against your answer(s). 12
• Do all rough work in this book. Cross out any work you do not want 13
to be marked. 14
Information 15
• The marks for questions are shown in brackets. TOTAL
• The maximum mark for this paper is 80.
• You may ask for more answer paper and graph paper. These must be
tagged securely to this answer booklet.
*JUN2283821H01*
IB/G/Jun22/E11 8382/1H
, 2
Do not write
outside the
Answer all questions in the spaces provided. box
1 Two variables have no correlation.
Which of these could be the value of the Spearman’s Rank Correlation
Coefficient between the two variables?
Circle your answer.
[1 mark]
1 –1 0.05 0.5
2 In quality assurance sampling applications, which measure is not used for the
completion of a quality control chart?
Circle your answer.
[1 mark]
mean skew range median
3 A bag contains only 8 red balls and 5 blue balls.
A ball is taken out at random and not replaced.
A second ball is taken out at random.
If the first ball is blue, what is the probability the second ball is also blue?
Circle your answer.
[1 mark]
1 5 5 4
3 39 12 13
4 Which of these is not a method of sampling, but is a procedure of categorisation
which may be used before sampling takes place?
Circle your answer.
[1 mark]
stratification systematic quota random
4
*02*
IB/G/Jun22/8382/1H
, 3
Do not write
outside the
5 The graph shows the percentage pass rate for UK driving tests at different ages. box
Source: PassMeFast
5 (a) Estimate the percentage chance that a 34-year-old will pass their test.
[1 mark]
Answer %
5 (b) Betty says that the older you are the less likely you are to pass your test.
Evaluate Betty’s statement, giving evidence both for and against.
[2 marks]
For
Against
3
Turn over ►
*03*
IB/G/Jun22/8382/1H
, 4
Do not write
outside the
6 Luton is an industrial town. box
The population pyramid shows the number of males living in Luton in
1851. The population values are rounded to the nearest hundred.
Source: Adapted from visionofbritain
The table shows the number of females living in Luton in 1851.
Population
Age group (to nearest hundred)
0 to 9 3200
10 to 19 3300
20 to 29 3000
30 to 39 1800
40 to 49 1100
50 to 59 800
60 to 69 500
70 + 300
6 (a) Complete the population pyramid to show the number of females living in Luton in 1851.
[3 marks]
*04*
IB/G/Jun22/8382/1H