M3
In this report, I am going to be discussing how the instruments used in our
experiments operate to justify why these instruments are appropriate to use.
For the experiments we carried out we used a set of equipment in order to obtain
reliable and accurate data. In the first experiment, we had to calibrate a pH
meter with buffer solution and measure the pH of different solutions with that pH
meter. For the second experiment, we determined the concentration of copper
ions in 3 samples (A, B and C) of mine water.
Equipment’s used:
pH meter
Colorimeter
Titration (pipette, burette, conical flask and white tile)
pH meter
At the start of the experiment, we were provided
with a pH meter and we calibrated it with buffer
solutions of known pH. A buffer solution is a
solution which resists changes in pH when alkali or
acid are added to it. After calibrating the pH
meter, we measured the pH of unknown solutions.
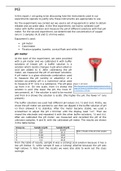
A pH meter is a glass electrode combination used
to measure the pH (acidity or alkalinity) of a
solution accurately. pH is a numerical value used
to measure of H+ ions in a substance. The pH goes Figure 1: pH meter
up from 0-14. On the scale, from 0-6 shows the http://hannainst.com/media/catalog/product/cache/1/i
mage/9df78eab33525d08d6e5fb8d27136e95/h/i/hi9810
solution is acid (the lower the pH, the more H + 0_checkerplus_1200.jpg
ions present), at 7 the solution is said to be neutral
and from 8-14 shows the solution is acidic (the higher the pH, the fewer H + ions
present).
The buffer solutions we used had different pH values (4.0, 7.0 and 10.0). Firstly, we
chose the pH meter we wanted to use then we dipped it the buffer solution of pH
4.0 then allowed it to stabilize. After the meter became stable, we used a
screwdriver to adjust the pH 4 trimmer until the display read “4.0”. Then we
rinsed the electrode and repeated it with the other buffer solutions, 7.0 and 10.0.
After we calibrated the pH meter, we measured and recorded the pH of the
unknown samples, A and B, with the calibrated pH meter. The results are shown
in the table below.
Group no. Sample A (pH) Sample B (pH)
1 4.4 14.43
Table 1: Results of the pH of the samples
2 0.8 11.2
3 0.16 14.0
4 1.55 15.4
5 1.1 11.6
From the table of results, sample A was a (strong) acid solution because it has a
low pH (below 7), while sample B was a (strong) alkaline because the pH was
high (above 7). Also from the results we were also able to work out the class
average.
In this report, I am going to be discussing how the instruments used in our
experiments operate to justify why these instruments are appropriate to use.
For the experiments we carried out we used a set of equipment in order to obtain
reliable and accurate data. In the first experiment, we had to calibrate a pH
meter with buffer solution and measure the pH of different solutions with that pH
meter. For the second experiment, we determined the concentration of copper
ions in 3 samples (A, B and C) of mine water.
Equipment’s used:
pH meter
Colorimeter
Titration (pipette, burette, conical flask and white tile)
pH meter
At the start of the experiment, we were provided
with a pH meter and we calibrated it with buffer
solutions of known pH. A buffer solution is a
solution which resists changes in pH when alkali or
acid are added to it. After calibrating the pH
meter, we measured the pH of unknown solutions.
A pH meter is a glass electrode combination used
to measure the pH (acidity or alkalinity) of a
solution accurately. pH is a numerical value used
to measure of H+ ions in a substance. The pH goes Figure 1: pH meter
up from 0-14. On the scale, from 0-6 shows the http://hannainst.com/media/catalog/product/cache/1/i
mage/9df78eab33525d08d6e5fb8d27136e95/h/i/hi9810
solution is acid (the lower the pH, the more H + 0_checkerplus_1200.jpg
ions present), at 7 the solution is said to be neutral
and from 8-14 shows the solution is acidic (the higher the pH, the fewer H + ions
present).
The buffer solutions we used had different pH values (4.0, 7.0 and 10.0). Firstly, we
chose the pH meter we wanted to use then we dipped it the buffer solution of pH
4.0 then allowed it to stabilize. After the meter became stable, we used a
screwdriver to adjust the pH 4 trimmer until the display read “4.0”. Then we
rinsed the electrode and repeated it with the other buffer solutions, 7.0 and 10.0.
After we calibrated the pH meter, we measured and recorded the pH of the
unknown samples, A and B, with the calibrated pH meter. The results are shown
in the table below.
Group no. Sample A (pH) Sample B (pH)
1 4.4 14.43
Table 1: Results of the pH of the samples
2 0.8 11.2
3 0.16 14.0
4 1.55 15.4
5 1.1 11.6
From the table of results, sample A was a (strong) acid solution because it has a
low pH (below 7), while sample B was a (strong) alkaline because the pH was
high (above 7). Also from the results we were also able to work out the class
average.