Tectonic Management Summary
Geophysical event (no human effect) -> Hazard (human risk) -> Disaster (>100 dead)
Disasters are when disruption exceeds ability of affected community to cope using their own resources
Risk: likelihood of a disaster causing damage
Mega disasters: multiple nations affected
Disaster/Risk Models
Increase in vulnerability to hazards: due to… (note – not more hazards just more human vulnerability)
• POVERTY
• INCREASE IN POP.
• GLOBALISATION and inherent interdependence (eg reliance on aid)
What affects vulnerability
1. Governance (lack of urban planning and allowed overcrowding, ignorance of isolated areas)
2. Demographics (very old and young populations are most vulnerable)
3. Economic Strength (quality of housing, healthcare, education, insurance, pop density)
4. Warning systems and scientific knowledge
5. Soil strength and topography (affecting buildings and transport infrastructure)
How is risk calculated (important in calculating
premiums in the insurance industry)?
a. WRI World Risk Index
b. Disaster Risk Index
c. Lloyds Risk Index
Trends over time with tectonic hazards:
The actual number of tectonic disasters is not increasing, we are seeing rise in the data due to better GIS
and then more thorough reporting (TV news and social media)
Monetary impacts of disasters are increasing! (Increasing wealth and assets and more insurance pay-outs)
Climate change DOES NOT increase the frequency of tectonics (only other disasters like cyclones and flood)
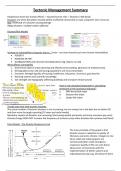
Parks Model - The Disaster Response Curve
The main principle of this graph is that
disaster causes a reduction in quality of
life/socio-economic climate. It begins to rise
when relief and rehab projects are
commenced (after initial emergency
response). Quality of life can even boost
above prior normal levels with the
implementation of better systems and
redevelopment plans eg, Christchurch 2011
Geophysical event (no human effect) -> Hazard (human risk) -> Disaster (>100 dead)
Disasters are when disruption exceeds ability of affected community to cope using their own resources
Risk: likelihood of a disaster causing damage
Mega disasters: multiple nations affected
Disaster/Risk Models
Increase in vulnerability to hazards: due to… (note – not more hazards just more human vulnerability)
• POVERTY
• INCREASE IN POP.
• GLOBALISATION and inherent interdependence (eg reliance on aid)
What affects vulnerability
1. Governance (lack of urban planning and allowed overcrowding, ignorance of isolated areas)
2. Demographics (very old and young populations are most vulnerable)
3. Economic Strength (quality of housing, healthcare, education, insurance, pop density)
4. Warning systems and scientific knowledge
5. Soil strength and topography (affecting buildings and transport infrastructure)
How is risk calculated (important in calculating
premiums in the insurance industry)?
a. WRI World Risk Index
b. Disaster Risk Index
c. Lloyds Risk Index
Trends over time with tectonic hazards:
The actual number of tectonic disasters is not increasing, we are seeing rise in the data due to better GIS
and then more thorough reporting (TV news and social media)
Monetary impacts of disasters are increasing! (Increasing wealth and assets and more insurance pay-outs)
Climate change DOES NOT increase the frequency of tectonics (only other disasters like cyclones and flood)
Parks Model - The Disaster Response Curve
The main principle of this graph is that
disaster causes a reduction in quality of
life/socio-economic climate. It begins to rise
when relief and rehab projects are
commenced (after initial emergency
response). Quality of life can even boost
above prior normal levels with the
implementation of better systems and
redevelopment plans eg, Christchurch 2011