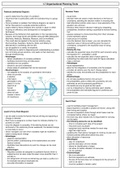
1.7 Organisational Planning Tools
Fishbone (ishikawa) Diagram: Decision Trees:
• used to determine the origin of a problem • visual tools
• visual tool than is particularly useful for brainstorming in a group • decision trees are used to make decisions in the face of
setting uncertainty, assisting the decision maker in choosing the
• Once a problem is realised, the fishbone diagram can lead to best alternative solution when one or more elements of the
further discussions to evaluate potential solutions equation are unknown.
• origins relate to Kaoru Ishikawa who worked in Japan in WW2 • Decision trees improve decision-making by integrating
focusing on efficiency and development of management probabilities, therefore making a quantitative forward-looking
techniques tool
• Because of the fishbone’s first application in the manufacturing • squares represent a choice branching from them whereas
industry, the 6 large bones are labelled using the 6Ms (Manpower, circles represent options
Machines, Methods, Materials, Measure, and EnvironMent) • costs are put in brackets
• This could also be applied to the service industry using • once the decision tree is drawn, you can calculate the
(Surroundings, Suppliers, Systems, Skills, and Safety) or expected value of doing something given the level of
alternatively to marketing with the 4Ps uncertainty, compared to the expected value of doing
• can be applied to a variety of situations something
• The fishbone is useful in diagnosing and understanding a problem • Solving the tree
but not finding actual solutions, only leads to their discovery • calculate the expected value of profit for each scenario using
through brainstorming the equation EV = probability x profit
• Advantages • calculate the net expected value of each option by
• allows visualisation of complex problems subtracting the initial costs from each EV figure calculated
• facilitates brainstorming and discussion • make a decision
• identifies the root problem • Advantages
• simple to use and understand • visual representation
• shows areas of weakness that can be improved • allow for the integration of uncertainty into the analysis
• Disadvantages • consider all options even the don’t change option
• not adapted to the analysis of quantitative information • identify the costs, the benefits and the probabilities for each
• does not provide option
a solution • Disadvantages
• information • do not take qualitative factors into account
generated is only • the probabilities used to reflect the uncertainty are only
useful if it is the estimates as are the projected payoff/return
result of an • the results are only as good as the inputs
honest • can be misleading by making estimates seem reliable
discussion • the probabilities and estimated figures for profit/loss are
• does not rank prone to bias
causes in terms
of importance
Gantt Chart:
• used to facilitate project management
• steps required to complete a project are shown, along with
their timing and duration
Lewin’s Force Field Diagram:
• the user is required to think through which tasks must be
completed before others can begin
• can be used to study the factors that are driving and opposing a
• the chart may also indicate who is responsible for carrying
change or decision
out the tasks
• Each force is assigned a number meant to indicate whether it is • the following elements can be identified:
powerful or weak
• time to complete each step of the project
• once the diagram is complete, if the deriving forces can be
• resources such as people
reinforced or the restraining forces weakened, the desired change
• equipment and machines needed for each step
is more likely to occur
• lags that might occur
• senior managers can see which variables might be modified in
• updating the chart allows managers to continue to plan and
order to being about change
foresee potential difficulties before they arise
• Advantages
• allow allocation of resources
• graphics representation • Advantages:
• permits better understanding of the stakeholders and other
• easy to understand
factors involved
• permits estimation of time needed
• illustrates hoe interventions to push for change can be most
• allows for identification of steps
effective
• can allow for better utilisation of resources
• Disadvantages
• can be updated
• Requires numbers be assigned to qualitative factors which is • Disadvantages
subjective but can also make this seem more scientific than it
• this is an estimation
actually is
• the time required is an estimate
• the assignment of forces as restraining can lead to conflict is it
• the size of the bars does not correspond to the amount of
for example was about employees etc
work to be done
• accurate information is required
• must be updated to remain useful