Lecture 1. Introduction
Three Components of Spatiotemporal Data
1. Spatial (where)
2. Temporal (when)
3. Data (what)
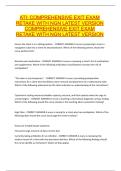
Spatiotemporal data is NOT new. Lienzo de Quauhquechollan: documents the space and
time history of the Spanish conquest from 1527 to 1530.
Why is spatiotemporal data?
Many historical processes are dynamic, showing changes of spatial patterns through time:
- Growth and decline of populations
- Epidemics
- Migrations
- Housing process etc.
Temporal Data
- Sequence of observations recorded at time intervals (typically regular time intervals)
- The standard terms used when describing time series data:
o T: the current time
o F(Xt): an observation at the current time
o T - n: a prior or lag time (e.g., T-1 for the previous time)
o T + n: future or forecast time (e.g., T+1 for the next time)
What is lag in the spatial domain? Distance in many direction
Why analyze a temporal data?
- Preparatory step before you develop a forecast of the series
- Commercial significance (make money purposes: demand and sales, number of
visitors)
Spatial data
- Non-spatial information
o Same as data in traditional data processing
o Numerical, categorical, ordinal, Boolean, etc.
o E.g., city name, city population
- Spatial information
o Spatial attribute: geographically referenced
▪ Neighborhood and extent
▪ Location e.g., longitude, latitude, elevation
o Spatial data representations
▪ Raster: gridded space
▪ Vector: point, line, polygon,
▪ Graph: node, edge, path
,Space and time
In some real-world problems, not enough to consider:
- Just snapshots of a spatial process at a given time,
- Or time series at a spatial location
The behavior from one time/spatial point to the next is important
Interactions across space and time
Interaction and impacts
Interaction and impact across processes and spatio-temporal scales.
,Goals of spatiotemporal data analysis
- Clustering (find outliers over the space and time)
- Predictive learning (predicts stock price)
- Change detection (weather)
- Frequent pattern mining
- Anomaly detection
- Relationship mining
Application domains
- Climate change
- Astronomy
- Finance
- Neuroscience
- Biology
- Epidemiology/health care
- And many more
Two generic properties of spatiotemporal data
- Autocorrelation
o Observations made at nearby locations and time stamps are not independent
o But correlated with each other
o Coherence of spatial observations - surface temperature values are
consistent at nearly locations
o Smoothness in temporal observations – changes in traffic activity occurs
smoothly over time
= NOT (statistically) independent.
- Heterogeneity
o ST datasets can show heterogeneity – non stationarity/variance – in both
space and time
o E.g., satellite measurements of vegetation at a location on earth show a
cyclical pattern in time due to the presence of seasonal cycles, e.g., winter vs
summer
o E.g., different spatial regions of the brain perform different functions and
hence show varying physiological responses to a stimuli.
Spatiotemporal Data Types
Data types:
1. Objects → vector format (for example points, A, B, C at different times)
2. Attributes → field (raster)
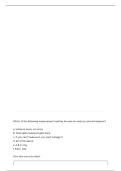
Four Common Types of Spatiotemporal Data
1. Event data: bunch of data points
a. Comprise of discrete events occurring at point locations and times
b. Incidences of crime events in the city
2. Trajectory data:
, a. Trajectory of moving bodies being measured
3. Reference points
a. Continuous ST field is being measured at moving ST reference cities-
measurements of surface temperature collected using weather balloons
4. Raster data
a. Observations of a ST field being collected a fixed (in location and shape) cells
in a ST grid (e.g., MRI scans of brain activity)
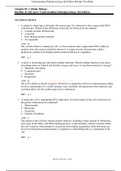
Converting between data types
Vector to raster: aggregate the counts of Point reference data to raster data:
events at every cell of an ST grid interpolate or aggregate the counts
Raster data to vector data: event Raster data to point reference data: take
extraction very vertex of the grid as a ST
Spatial Maps and ST raster
Spatial Maps (ability to create a 3D map of the environment)
• ST raster data can be viewed as a collection of spatial maps observed at every time
stamp.
• Common approach for extracting features among spatial maps is using image
segmentation techniques.
ST Raster
• Precipitation data: three-dimensional (3D) array where the first two dimensions
capture 2D space and the third-dimension captures time
• fMRI data: four-dimensional (4D) array where the first three dimensions capture 3D
space and the fourth-dimension captures time
Temporal Lag
• The period of time between two closely related events
• E.g., time lag between infection and system onset of coronavirus
• Time lag between the peak of coronavirus in China and rest of the world
Exploratory analysis of ST data
Explore spatiotemporal data in terms summaries of its first order and second order
characteristics
Three Components of Spatiotemporal Data
1. Spatial (where)
2. Temporal (when)
3. Data (what)
Spatiotemporal data is NOT new. Lienzo de Quauhquechollan: documents the space and
time history of the Spanish conquest from 1527 to 1530.
Why is spatiotemporal data?
Many historical processes are dynamic, showing changes of spatial patterns through time:
- Growth and decline of populations
- Epidemics
- Migrations
- Housing process etc.
Temporal Data
- Sequence of observations recorded at time intervals (typically regular time intervals)
- The standard terms used when describing time series data:
o T: the current time
o F(Xt): an observation at the current time
o T - n: a prior or lag time (e.g., T-1 for the previous time)
o T + n: future or forecast time (e.g., T+1 for the next time)
What is lag in the spatial domain? Distance in many direction
Why analyze a temporal data?
- Preparatory step before you develop a forecast of the series
- Commercial significance (make money purposes: demand and sales, number of
visitors)
Spatial data
- Non-spatial information
o Same as data in traditional data processing
o Numerical, categorical, ordinal, Boolean, etc.
o E.g., city name, city population
- Spatial information
o Spatial attribute: geographically referenced
▪ Neighborhood and extent
▪ Location e.g., longitude, latitude, elevation
o Spatial data representations
▪ Raster: gridded space
▪ Vector: point, line, polygon,
▪ Graph: node, edge, path
,Space and time
In some real-world problems, not enough to consider:
- Just snapshots of a spatial process at a given time,
- Or time series at a spatial location
The behavior from one time/spatial point to the next is important
Interactions across space and time
Interaction and impacts
Interaction and impact across processes and spatio-temporal scales.
,Goals of spatiotemporal data analysis
- Clustering (find outliers over the space and time)
- Predictive learning (predicts stock price)
- Change detection (weather)
- Frequent pattern mining
- Anomaly detection
- Relationship mining
Application domains
- Climate change
- Astronomy
- Finance
- Neuroscience
- Biology
- Epidemiology/health care
- And many more
Two generic properties of spatiotemporal data
- Autocorrelation
o Observations made at nearby locations and time stamps are not independent
o But correlated with each other
o Coherence of spatial observations - surface temperature values are
consistent at nearly locations
o Smoothness in temporal observations – changes in traffic activity occurs
smoothly over time
= NOT (statistically) independent.
- Heterogeneity
o ST datasets can show heterogeneity – non stationarity/variance – in both
space and time
o E.g., satellite measurements of vegetation at a location on earth show a
cyclical pattern in time due to the presence of seasonal cycles, e.g., winter vs
summer
o E.g., different spatial regions of the brain perform different functions and
hence show varying physiological responses to a stimuli.
Spatiotemporal Data Types
Data types:
1. Objects → vector format (for example points, A, B, C at different times)
2. Attributes → field (raster)
Four Common Types of Spatiotemporal Data
1. Event data: bunch of data points
a. Comprise of discrete events occurring at point locations and times
b. Incidences of crime events in the city
2. Trajectory data:
, a. Trajectory of moving bodies being measured
3. Reference points
a. Continuous ST field is being measured at moving ST reference cities-
measurements of surface temperature collected using weather balloons
4. Raster data
a. Observations of a ST field being collected a fixed (in location and shape) cells
in a ST grid (e.g., MRI scans of brain activity)
Converting between data types
Vector to raster: aggregate the counts of Point reference data to raster data:
events at every cell of an ST grid interpolate or aggregate the counts
Raster data to vector data: event Raster data to point reference data: take
extraction very vertex of the grid as a ST
Spatial Maps and ST raster
Spatial Maps (ability to create a 3D map of the environment)
• ST raster data can be viewed as a collection of spatial maps observed at every time
stamp.
• Common approach for extracting features among spatial maps is using image
segmentation techniques.
ST Raster
• Precipitation data: three-dimensional (3D) array where the first two dimensions
capture 2D space and the third-dimension captures time
• fMRI data: four-dimensional (4D) array where the first three dimensions capture 3D
space and the fourth-dimension captures time
Temporal Lag
• The period of time between two closely related events
• E.g., time lag between infection and system onset of coronavirus
• Time lag between the peak of coronavirus in China and rest of the world
Exploratory analysis of ST data
Explore spatiotemporal data in terms summaries of its first order and second order
characteristics