Species Interaction
Data handling example:
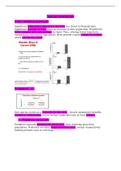
Significant reduction in understory diversity in a forest in Pennsylvania.
Significant increase in ferns after an increase in deer population. Hypothesis:
ferns compete with tree saplings for light. Thus, altering forest long term
composition. Alternative hypothesis: ferns provide a good habitat for rodents,
whom eat the tree seeds.
Predation: +/-
One species serves as a resource for the other – clearly asymmetric benefits.
Predatory relationships can be further subdivided into at least 4 types:
1. Predators sensu latu
Predators typically consume the whole prey, thus removing prey from
population. Predators are often larger than their prey, except cooperatively
hunting animals such as wild dogs.
, 2. Herbivores
Herbivores eat whole plants or parts of plants.
3. Parasites
Parasites consume parts of living prey organisms. They often attach
themselves to the body of their host, and fully depend on a host. Typically
do not kill their host.
4. Parasitoids
Wasps and flies whose larvae consume the tissues of living host. The
larvae typically do kill the host.
Prey and predator population sizes tend to cycle:
Fascinated ecologists since the 1920s due to its consistency and
synchronicity over thousands of Kms. An example: no. of lynx and
snowshoe hare caught in the Canadian Arctic.
Q1: Do predator prey interactions cause populations to
oscillate, or are both populations responding to some climate
cycle that affects resources available to both?
Mathematical Models:
Lotka and Volterra developed mathematical models for predator-prey
relationships:
If pop growth is: birth – deaths, or dN/dt = rN and P = Predators & V =
Prey (victims)
Then in prey population: dN/Dt = rpreyV – cVP (cVP – additional
deaths due to predators, assumed to be a proportion c of encounters
between prey and predators (VP), where c is the capture efficiency).
And in predator population: dN/Dt = acVP – Dp (acVP – predator birth
assumed to be a function (a) of obtaining food (cVP). d = death rate in
predator)
Isoclines:
Data handling example:
Significant reduction in understory diversity in a forest in Pennsylvania.
Significant increase in ferns after an increase in deer population. Hypothesis:
ferns compete with tree saplings for light. Thus, altering forest long term
composition. Alternative hypothesis: ferns provide a good habitat for rodents,
whom eat the tree seeds.
Predation: +/-
One species serves as a resource for the other – clearly asymmetric benefits.
Predatory relationships can be further subdivided into at least 4 types:
1. Predators sensu latu
Predators typically consume the whole prey, thus removing prey from
population. Predators are often larger than their prey, except cooperatively
hunting animals such as wild dogs.
, 2. Herbivores
Herbivores eat whole plants or parts of plants.
3. Parasites
Parasites consume parts of living prey organisms. They often attach
themselves to the body of their host, and fully depend on a host. Typically
do not kill their host.
4. Parasitoids
Wasps and flies whose larvae consume the tissues of living host. The
larvae typically do kill the host.
Prey and predator population sizes tend to cycle:
Fascinated ecologists since the 1920s due to its consistency and
synchronicity over thousands of Kms. An example: no. of lynx and
snowshoe hare caught in the Canadian Arctic.
Q1: Do predator prey interactions cause populations to
oscillate, or are both populations responding to some climate
cycle that affects resources available to both?
Mathematical Models:
Lotka and Volterra developed mathematical models for predator-prey
relationships:
If pop growth is: birth – deaths, or dN/dt = rN and P = Predators & V =
Prey (victims)
Then in prey population: dN/Dt = rpreyV – cVP (cVP – additional
deaths due to predators, assumed to be a proportion c of encounters
between prey and predators (VP), where c is the capture efficiency).
And in predator population: dN/Dt = acVP – Dp (acVP – predator birth
assumed to be a function (a) of obtaining food (cVP). d = death rate in
predator)
Isoclines: