A-level
GEOGRAPHY
Paper 1 Physical Geography
Insert
This insert contains:
Figure 1 for use with Question 1
Figure 2 for use with Question 1
Figures 3a and 3b for use with Question 2
Figure 5 for use with Question 3
Figure 7 for use with Question 4
Figures 9a – 9d for use with Question 5
Figure 10 for use with Question 5
Figures 11 for use with Question 6
Figures 12 for use with Question 6
G/KL/Jun21/E3 7037/1
, 2
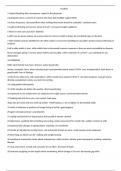
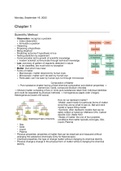
Figure 1
The impact of different rates of deforestation and afforestation upon land surface
temperature (LST) at different latitudes. The data was collected between 2000 and 2011.
75 North
65
55
45
35
25
15
Latitude 5 Equator
(degrees)
5
15
25
35
45
55
65 South
– 90 – 70 – 50 – 30 – 10 10 30 50 70 90
Forest change (%)
Deforestation Afforestation
Key
Change in land surface temperature (°C)
1.7 1.5 1.0 0.75 0.5 0.25 0 – 0.5 – 1.0 – 1.5 – 1.7
.
G/Jun21/7037/1
GEOGRAPHY
Paper 1 Physical Geography
Insert
This insert contains:
Figure 1 for use with Question 1
Figure 2 for use with Question 1
Figures 3a and 3b for use with Question 2
Figure 5 for use with Question 3
Figure 7 for use with Question 4
Figures 9a – 9d for use with Question 5
Figure 10 for use with Question 5
Figures 11 for use with Question 6
Figures 12 for use with Question 6
G/KL/Jun21/E3 7037/1
, 2
Figure 1
The impact of different rates of deforestation and afforestation upon land surface
temperature (LST) at different latitudes. The data was collected between 2000 and 2011.
75 North
65
55
45
35
25
15
Latitude 5 Equator
(degrees)
5
15
25
35
45
55
65 South
– 90 – 70 – 50 – 30 – 10 10 30 50 70 90
Forest change (%)
Deforestation Afforestation
Key
Change in land surface temperature (°C)
1.7 1.5 1.0 0.75 0.5 0.25 0 – 0.5 – 1.0 – 1.5 – 1.7
.
G/Jun21/7037/1