

BTEC Level 3 Extended Diploma in Business
Unit 10: Market Research in Business
P5: interpret findings from the research presenting them clearly in an appropriate format
M3: analyze the research findings and make recommendations on how marketing strategies
could be adapted or implemented.
Introduction
This assignment focuses on the analysis and interpretation of the questionnaire that was
prepared and distributed to various individuals. This questionnaire focused on the two methods
of banking and which method banking customers preferred. Also, reason behind these choices
were collected in order to further understand the reason for the preferences and how we can
improve to make both methods better for the customers.
Presentation of Data
Due to the pandemic (Covid-19), the collection of data was interrupted. However, using Google
Forms enabled the gathering of data online. The aim was to collect data from 20 respondents,
which was accomplished.
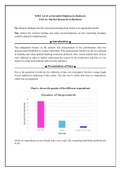
Chart 1: shows the gender of the different respondents
Of the 20 respondents,15 were female and 4 were male. The remaining individuals preferred not
to say.
, Chart 2: shows the age range of the respondents.
Of the 20 respondents 65% were 18-26, 15% were 27-35, 10% were 36-44 and 45-54 and 0% were
55+.
Chart 3: shows the occupation of the respondents.
Of the 20 respondents, 7 worked in the field of healthcare/medicine, 5 were full-time students, 3
were in business/finance, 2 were self-employed and 1 was in the fields on education workers, law
enforcements and arts/entertainment.
Unit 10: Market Research in Business
P5: interpret findings from the research presenting them clearly in an appropriate format
M3: analyze the research findings and make recommendations on how marketing strategies
could be adapted or implemented.
Introduction
This assignment focuses on the analysis and interpretation of the questionnaire that was
prepared and distributed to various individuals. This questionnaire focused on the two methods
of banking and which method banking customers preferred. Also, reason behind these choices
were collected in order to further understand the reason for the preferences and how we can
improve to make both methods better for the customers.
Presentation of Data
Due to the pandemic (Covid-19), the collection of data was interrupted. However, using Google
Forms enabled the gathering of data online. The aim was to collect data from 20 respondents,
which was accomplished.
Chart 1: shows the gender of the different respondents
Of the 20 respondents,15 were female and 4 were male. The remaining individuals preferred not
to say.
, Chart 2: shows the age range of the respondents.
Of the 20 respondents 65% were 18-26, 15% were 27-35, 10% were 36-44 and 45-54 and 0% were
55+.
Chart 3: shows the occupation of the respondents.
Of the 20 respondents, 7 worked in the field of healthcare/medicine, 5 were full-time students, 3
were in business/finance, 2 were self-employed and 1 was in the fields on education workers, law
enforcements and arts/entertainment.


