Applying the DCF method to your start-up
1. Calculating cash flows
In the first step we calculate the cash flows in future years, which we will then at a later stage
discount back to today. Remember that the cash flow is calculated as follows:
Cash flow= EBIT(1 - Tax Rate) + Depreciation – Capital Expenditures – Δ Net Working Capital
To obtain the different items from this equation (thus the EBIT(1-tax rate), depreciation and capital
expenditures1), you can use the table that I explained in my third lecture:
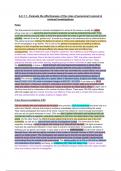
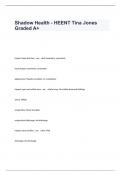
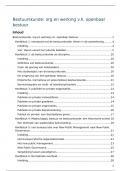
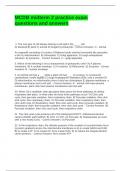
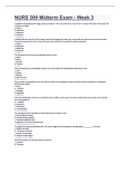
Step 1) First we estimate what the total market for my product will be (in dollars or euros) for the
coming 10 years (2nd column). Then I estimate my market share (3rd column). Please note that the
numbers in column 3 (the market share) should of course be based on realistic assumptions.
Step 2) multiply the total market by my own market share for each year to obtain my revenues in
each year (4th column).
Step 3) Then in the fifth column I input my assumptions regarding the pre-tax operating margin (this
is the percentage of my revenues that are actual profits before taxes). You can find this number for
different industries via
http://pages.stern.nyu.edu/~adamodar/New_Home_Page/datafile/margin.html, simply take the net
profit margin for your industry. However, the number you find is the profit margin for mature
companies, and since your company is not mature yet you will only reach this number in year 10. In
the years before you will likely start from a negative profit margin and work your way up to this
industry average pre-tax operating margin that is the average for mature companies in your industry.
1
Note that you can assume the change in net working capital to be zero (as mentioned during the lecture)
, In the example table you see that the company reaches the industry average pre-tax operating
margin of 13% in 2027 but starts at a negative margin in 2018 (and then works its way up from this
negative margin to the margin of 13%).
Step 4) Then in the sixth column you calculate the pre-tax operating income by multiplying your
revenues (fourth column) in each year by your pre-tax operating margin in each year (fifth column) to
obtain you pre-tax operating income. Then in the seventh column you calculate the after-tax
operating income by subtracting taxes (usually between 20% to 40%, simply google it). In the
example the tax rate used is 40%. Thus operating income then equals the EBIT*(1-t) from the cash
flow equation above.
Step 5) The next item from that equation that we need is the depreciation; you can obtain
depreciation by either looking at past balance sheets if you have them or – if you do not have any
past information- by simply assuming that depreciation is a fixed percentage of the operating income
calculated under step 4. Around 3% to 4% of sales is the average number for most companies.
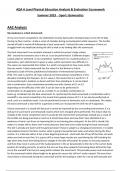
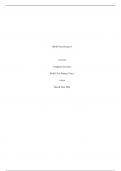
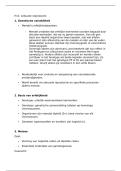
Step 6) Then, the final item we need from the cash flow equation are the capital expenditures, those
are calculated in the following table:
Firstly, you calculate the change in revenues in each year, you then input the sales/capital ratio for
your industry (see http://pages.stern.nyu.edu/~adamodar/New_Home_Page/datafile/capex.html)
and then you divide the change in revenues by the sales/capital ratio to find the investment you are
predicted to make in each year. This ‘reinvestment’ equals the capital expenditures from the cash
flow equation that is provided at the beginning of this document.
Step 7) Calculate the cash flow in each of the coming 10 years by simply filling in the numbers that
you obtained from step 1 to step 6 in the cash flow equation at the beginning of this document.
1. Calculating cash flows
In the first step we calculate the cash flows in future years, which we will then at a later stage
discount back to today. Remember that the cash flow is calculated as follows:
Cash flow= EBIT(1 - Tax Rate) + Depreciation – Capital Expenditures – Δ Net Working Capital
To obtain the different items from this equation (thus the EBIT(1-tax rate), depreciation and capital
expenditures1), you can use the table that I explained in my third lecture:
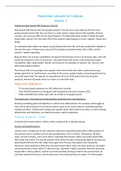
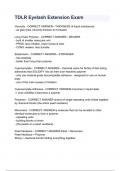
Step 1) First we estimate what the total market for my product will be (in dollars or euros) for the
coming 10 years (2nd column). Then I estimate my market share (3rd column). Please note that the
numbers in column 3 (the market share) should of course be based on realistic assumptions.
Step 2) multiply the total market by my own market share for each year to obtain my revenues in
each year (4th column).
Step 3) Then in the fifth column I input my assumptions regarding the pre-tax operating margin (this
is the percentage of my revenues that are actual profits before taxes). You can find this number for
different industries via
http://pages.stern.nyu.edu/~adamodar/New_Home_Page/datafile/margin.html, simply take the net
profit margin for your industry. However, the number you find is the profit margin for mature
companies, and since your company is not mature yet you will only reach this number in year 10. In
the years before you will likely start from a negative profit margin and work your way up to this
industry average pre-tax operating margin that is the average for mature companies in your industry.
1
Note that you can assume the change in net working capital to be zero (as mentioned during the lecture)
, In the example table you see that the company reaches the industry average pre-tax operating
margin of 13% in 2027 but starts at a negative margin in 2018 (and then works its way up from this
negative margin to the margin of 13%).
Step 4) Then in the sixth column you calculate the pre-tax operating income by multiplying your
revenues (fourth column) in each year by your pre-tax operating margin in each year (fifth column) to
obtain you pre-tax operating income. Then in the seventh column you calculate the after-tax
operating income by subtracting taxes (usually between 20% to 40%, simply google it). In the
example the tax rate used is 40%. Thus operating income then equals the EBIT*(1-t) from the cash
flow equation above.
Step 5) The next item from that equation that we need is the depreciation; you can obtain
depreciation by either looking at past balance sheets if you have them or – if you do not have any
past information- by simply assuming that depreciation is a fixed percentage of the operating income
calculated under step 4. Around 3% to 4% of sales is the average number for most companies.
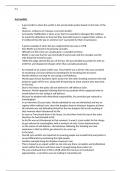
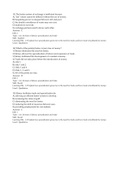
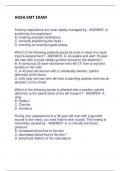
Step 6) Then, the final item we need from the cash flow equation are the capital expenditures, those
are calculated in the following table:
Firstly, you calculate the change in revenues in each year, you then input the sales/capital ratio for
your industry (see http://pages.stern.nyu.edu/~adamodar/New_Home_Page/datafile/capex.html)
and then you divide the change in revenues by the sales/capital ratio to find the investment you are
predicted to make in each year. This ‘reinvestment’ equals the capital expenditures from the cash
flow equation that is provided at the beginning of this document.
Step 7) Calculate the cash flow in each of the coming 10 years by simply filling in the numbers that
you obtained from step 1 to step 6 in the cash flow equation at the beginning of this document.