

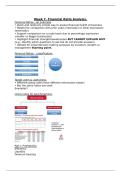
Week 7- Financial Ratio Analysis.
Financial Ratios - an overview
• Quick and relatively simple way to assess financial health of business
• Helpful for comparison with prior years (internally) or other businesses
(externally)
• Support comparison on a scale basis due to percentage expression
(smaller vs bigger businesses)
• Highlight financial strengths/weaknesses BUT CANNOT EXPLAIN WHY
(e.g., identify which questions to ask but do not provide answers)
• Utilised for initial decision-making purposes by investors, lenders or
management Starting point.
Financial Ratios – classification:
Target users & usefulness:
• Different group users have different information needs!
• Not the same ratios are used
Examples?
Using ratios for benchmarking:
Part I: Profitability:
Efficiency
Liquidity
Financial Gearing
, Investment
Profitability ratios:
• Gross profit margin (GPM): measures the profitability in terms of
firm’s ability to buy (or produce) and sell goods or services before any
other expenses are taken into account.
GPM= [Gross Profit/Sales Revenue] (expressed as %)
• Operating profit margin (or EBIT): shows how much profit a
company makes on a dollar of sales after paying for variable costs of
production, such as wages and raw materials (operating expenses), but
before paying interest or tax. It’s very important measure since the way
that firm is financed (which can be reflected on the taxes or interest) are
not influencing the measure.
OPM= [Operating Profit/Sales Revenue] (expressed as %)
Profitability ratios
• Net profit margin (NPM): shows the overall profitability of the firm
when all costs and expenses (e.g., cost of sale, operating expenses,
interest and taxes) have been deducted.
-It shows the profit which could be distributed to shareholders, expressed
as a percentage of revenues.
NPM= [(Revenues - Cost of Goods Sold – Operating Expenses-
Interest - Tax)/Revenues] or NPM= [Net Income/Revenues]
(expressed as %).
• Return on Capital Employed (ROCE): measures how efficiently a
company is using its capital to generate profits. This metric is considered
one of the best profitability ratios and is commonly used by investors to
determine whether a company is suitable to invest in or not.
ROCE= [Operating Profit/Capital employed] (expressed as %)
Other versions:
1. ROCE= [Operating Profit/(Total Assets – Current Liabilities)]
2. ROCE= [Operating Profit/(Equity+ Non-current Liabilities)]
-The general rule about ROCE is the higher the ratio, the better. That's
because it is a measure of profitability.
-A ROCE of at least 20% is usually a good sign that the company is in a
good financial position.
• Return on Equity (ROE): provides investors with insight into how
efficiently a
company is handling the money that shareholders have contributed to it.
In other
words, ROE measures the profitability of a corporation in relation to
stockholders’
equity.
ROE= [Net Profit (Income)/Shareholder’s Equity] (expressed as %)
-The general rule about ROE is the higher the ratio, the better.
-The S&P 500 had an average ROE in 2021 of 21.88%.
• Return on Assets (ROA): how profitable a company is in relation to its
total
assets. Corporate management, analysts, and investors can use ROA to
determine how efficiently a company uses its assets to generate a profit.
Financial Ratios - an overview
• Quick and relatively simple way to assess financial health of business
• Helpful for comparison with prior years (internally) or other businesses
(externally)
• Support comparison on a scale basis due to percentage expression
(smaller vs bigger businesses)
• Highlight financial strengths/weaknesses BUT CANNOT EXPLAIN WHY
(e.g., identify which questions to ask but do not provide answers)
• Utilised for initial decision-making purposes by investors, lenders or
management Starting point.
Financial Ratios – classification:
Target users & usefulness:
• Different group users have different information needs!
• Not the same ratios are used
Examples?
Using ratios for benchmarking:
Part I: Profitability:
Efficiency
Liquidity
Financial Gearing
, Investment
Profitability ratios:
• Gross profit margin (GPM): measures the profitability in terms of
firm’s ability to buy (or produce) and sell goods or services before any
other expenses are taken into account.
GPM= [Gross Profit/Sales Revenue] (expressed as %)
• Operating profit margin (or EBIT): shows how much profit a
company makes on a dollar of sales after paying for variable costs of
production, such as wages and raw materials (operating expenses), but
before paying interest or tax. It’s very important measure since the way
that firm is financed (which can be reflected on the taxes or interest) are
not influencing the measure.
OPM= [Operating Profit/Sales Revenue] (expressed as %)
Profitability ratios
• Net profit margin (NPM): shows the overall profitability of the firm
when all costs and expenses (e.g., cost of sale, operating expenses,
interest and taxes) have been deducted.
-It shows the profit which could be distributed to shareholders, expressed
as a percentage of revenues.
NPM= [(Revenues - Cost of Goods Sold – Operating Expenses-
Interest - Tax)/Revenues] or NPM= [Net Income/Revenues]
(expressed as %).
• Return on Capital Employed (ROCE): measures how efficiently a
company is using its capital to generate profits. This metric is considered
one of the best profitability ratios and is commonly used by investors to
determine whether a company is suitable to invest in or not.
ROCE= [Operating Profit/Capital employed] (expressed as %)
Other versions:
1. ROCE= [Operating Profit/(Total Assets – Current Liabilities)]
2. ROCE= [Operating Profit/(Equity+ Non-current Liabilities)]
-The general rule about ROCE is the higher the ratio, the better. That's
because it is a measure of profitability.
-A ROCE of at least 20% is usually a good sign that the company is in a
good financial position.
• Return on Equity (ROE): provides investors with insight into how
efficiently a
company is handling the money that shareholders have contributed to it.
In other
words, ROE measures the profitability of a corporation in relation to
stockholders’
equity.
ROE= [Net Profit (Income)/Shareholder’s Equity] (expressed as %)
-The general rule about ROE is the higher the ratio, the better.
-The S&P 500 had an average ROE in 2021 of 21.88%.
• Return on Assets (ROA): how profitable a company is in relation to its
total
assets. Corporate management, analysts, and investors can use ROA to
determine how efficiently a company uses its assets to generate a profit.


