Sales Forecasting
Sales forecasting involves a firm using a range of techniques and
information to predict future sales volumes. It is a key business process
Topic 2.2 Financial Planning
as the information will be used to make many other key decisions, such
as purchasing raw materials, staffing, marketing, and financing the firm. Break-Even Analysis
A firm may use a range of information in order to accurately carry out a The break-even output is the point at which a firm’s revenue generated through
sales forecast. This may include: the sales of its products will cover the total costs. At break-even, the firm is
Market research (e.g. market reports and customer surveys) making neither a profit nor a loss. Break-even analysis can be used to help a
Back-data economic forecasts (e.g. time series analysis). firm make important decisions about costs, prices and expected profit.
The process of conducting an accurate sales forecast is not easy and any
forecast has its limitations:
Fluctuations in economic variables – unforeseen external shocks
such as changing commodity prices.
The data used – the quality of the data may vary considerably.
Volatile markets – some markets are more volatile and
unpredictable than others.
Subjective expert opinions – many forecasts will be supported by
the opinion and experience of a manager within the firm.
Volatile customer tastes and preferences – it can change.
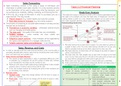
1. Plot total revenue line at each level of output. You only need two points on
a graph to draw a line. You know total revenue will start at 0 so you only
Sales, Revenue, and Costs need to calculate revenue at one other output level to draw your line.
In order to calculate profit and make financial decisions a firm must be able to 2. Plot fixed costs line. As fixed costs will not change at any level of output, it
accurately calculate sales volumes, sales revenue, and all business costs, broken will be a horizontal line.
down into fixed costs and variable costs. 3. Plot total costs line. Add variable cost at each level of output to the fixed
Sales Volume and Sales Revenue costs. As your total costs line at 0 will start at the same point as fixed costs
The volume of sales (expressed in units) is sometimes difficult for a firm you only need to calculate one other point to get your line.
to calculate. E.g. a restaurant will use the number of meals sold, whereas 4. Where total costs meet total revenue is where break-even is identified.
a car manufacturer will simply use the number of cars. 5. If the current level of output is below break-even the firm will make a loss. If
Revenue is the value of sales made during a trading period. It also includes it is above break-even it will generate a profit.
products sold on credit as well as those sold for cash. BENEFITS LIMITATIONS
A firm can increase revenue by increasing the price of their products and It can be used to analyse the Break-even analysis simplifies
by stimulating more demand. impact of varying customers, what can be a very complex
Business Costs prices, and costs on a firm’s profit process – most firms sell multiple
Variable costs – those that change directly with the level of output or products, which makes break-
sales, e.g. materials. even more difficult.
Fixed costs – those that do not change with the level of output or sales, It is simple and easy to use Costs are rarely constant – break-
e.g. rent. even analysis presumes that
costs stay the same over various
levels of output.
Sales forecasting involves a firm using a range of techniques and
information to predict future sales volumes. It is a key business process
Topic 2.2 Financial Planning
as the information will be used to make many other key decisions, such
as purchasing raw materials, staffing, marketing, and financing the firm. Break-Even Analysis
A firm may use a range of information in order to accurately carry out a The break-even output is the point at which a firm’s revenue generated through
sales forecast. This may include: the sales of its products will cover the total costs. At break-even, the firm is
Market research (e.g. market reports and customer surveys) making neither a profit nor a loss. Break-even analysis can be used to help a
Back-data economic forecasts (e.g. time series analysis). firm make important decisions about costs, prices and expected profit.
The process of conducting an accurate sales forecast is not easy and any
forecast has its limitations:
Fluctuations in economic variables – unforeseen external shocks
such as changing commodity prices.
The data used – the quality of the data may vary considerably.
Volatile markets – some markets are more volatile and
unpredictable than others.
Subjective expert opinions – many forecasts will be supported by
the opinion and experience of a manager within the firm.
Volatile customer tastes and preferences – it can change.
1. Plot total revenue line at each level of output. You only need two points on
a graph to draw a line. You know total revenue will start at 0 so you only
Sales, Revenue, and Costs need to calculate revenue at one other output level to draw your line.
In order to calculate profit and make financial decisions a firm must be able to 2. Plot fixed costs line. As fixed costs will not change at any level of output, it
accurately calculate sales volumes, sales revenue, and all business costs, broken will be a horizontal line.
down into fixed costs and variable costs. 3. Plot total costs line. Add variable cost at each level of output to the fixed
Sales Volume and Sales Revenue costs. As your total costs line at 0 will start at the same point as fixed costs
The volume of sales (expressed in units) is sometimes difficult for a firm you only need to calculate one other point to get your line.
to calculate. E.g. a restaurant will use the number of meals sold, whereas 4. Where total costs meet total revenue is where break-even is identified.
a car manufacturer will simply use the number of cars. 5. If the current level of output is below break-even the firm will make a loss. If
Revenue is the value of sales made during a trading period. It also includes it is above break-even it will generate a profit.
products sold on credit as well as those sold for cash. BENEFITS LIMITATIONS
A firm can increase revenue by increasing the price of their products and It can be used to analyse the Break-even analysis simplifies
by stimulating more demand. impact of varying customers, what can be a very complex
Business Costs prices, and costs on a firm’s profit process – most firms sell multiple
Variable costs – those that change directly with the level of output or products, which makes break-
sales, e.g. materials. even more difficult.
Fixed costs – those that do not change with the level of output or sales, It is simple and easy to use Costs are rarely constant – break-
e.g. rent. even analysis presumes that
costs stay the same over various
levels of output.