
Cumulative Frequency Diagrams (H).pdf)*#$)(&)(*#%)(*_#%()J$YM(%)U$I^__O%$II)(UI#_%K#+_)+_%O_@(UJ))(O#_@$+_
Cumulative Frequency Diagrams (H).pdf Cumulative Frequency Diagrams (H).pdf
Edexcel GCSE Maths - Cumulative Frequency Diagrams (H) PhysicsAndMathsTutor.com
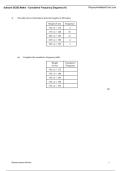
1. The table shows information about the heights of 40 bushes.
Height (h cm) Frequency
170 ≤ h < 175 5
175 ≤ h < 180 18
180 ≤ h < 185 12
185 ≤ h < 190 4
190 ≤ h < 195 1
(a) Complete the cumulative frequency table.
Height Cumulative
(h cm) Frequency
170 ≤ h < 175
170 ≤ h < 180
170 ≤ h < 185
170 ≤ h < 190
170 ≤ h < 195
(1)
Edexcel Internal Review 1
Cumulative Frequency Diagrams (H).pdf Cumulative Frequency Diagrams (H).pdf Cumulative Frequency Diagrams (H).pdf
, Cumulative Frequency Diagrams (H).pdf)*#$)(&)(*#%)(*_#%()J$YM(%)U$I^__O%$II)(UI#_%K#+_)+_%O_@(UJ))(O#_@$+_
Cumulative Frequency Diagrams (H).pdf Cumulative Frequency Diagrams (H).pdf
Edexcel GCSE Maths - Cumulative Frequency Diagrams (H) PhysicsAndMathsTutor.com
(b) On the grid, draw a cumulative frequency graph for your table.
40
Cumulative
frequency
30
20
10
0
170 175 180 185 190 195
Height (h cm)
(2)
(c) Use the graph to find an estimate for the median height of the bushes.
……………………… cm
(1)
(Total 4 marks)
Edexcel Internal Review 2
Cumulative Frequency Diagrams (H).pdf Cumulative Frequency Diagrams (H).pdf Cumulative Frequency Diagrams (H).pdf
, Cumulative Frequency Diagrams (H).pdf)*#$)(&)(*#%)(*_#%()J$YM(%)U$I^__O%$II)(UI#_%K#+_)+_%O_@(UJ))(O#_@$+_
Cumulative Frequency Diagrams (H).pdf Cumulative Frequency Diagrams (H).pdf
Edexcel GCSE Maths - Cumulative Frequency Diagrams (H) PhysicsAndMathsTutor.com
2. 40 boys each completed a puzzle.
The cumulative frequency graph below gives information about the times it took them to
complete the puzzle.
(a) Use the graph to find an estimate for the median time
............... seconds
(1)
40
Cumulative 30
frequency
20
10
O 10 20 30 40 50 60
Time in seconds
For the boys
the minimum time to complete the puzzle was 9 seconds
and the maximum time to complete the puzzle was 57 seconds.
(b) Use this information and the cumulative frequency graph to draw a box plot showing
information about the boy’s times.
0 10 20 30 40 50 60
Time in seconds
(3)
Edexcel Internal Review 3
Cumulative Frequency Diagrams (H).pdf Cumulative Frequency Diagrams (H).pdf Cumulative Frequency Diagrams (H).pdf
, Cumulative Frequency Diagrams (H).pdf)*#$)(&)(*#%)(*_#%()J$YM(%)U$I^__O%$II)(UI#_%K#+_)+_%O_@(UJ))(O#_@$+_
Cumulative Frequency Diagrams (H).pdf Cumulative Frequency Diagrams (H).pdf
Edexcel GCSE Maths - Cumulative Frequency Diagrams (H) PhysicsAndMathsTutor.com
The box plot below shows information about the times taken by 40 girls to complete the
same puzzle.
0 10 20 30 40 50 60
Time in seconds
(c) Make two comparisons between the boys’ times and the girls’ times.
...............................................................................................................................................
...............................................................................................................................................
(2)
(Total 6 marks)
3. The table gives information about the ages of 160 employees of an IT company.
Age (A) in years Frequency
15 < A ≤ 25 44
25 < A ≤ 35 56
35 < A ≤ 45 34
45 < A ≤ 55 19
55 < A ≤ 65 7
(a) Write down the modal class interval.
.......................................
(1)
(b) Complete the cumulative frequency table.
Age (A) in years Cumulative Frequency
15 < A ≤ 25
15 < A ≤ 35
15 < A ≤ 45
15 < A ≤ 55
Edexcel Internal Review 4
Cumulative Frequency Diagrams (H).pdf Cumulative Frequency Diagrams (H).pdf Cumulative Frequency Diagrams (H).pdf
Cumulative Frequency Diagrams (H).pdf Cumulative Frequency Diagrams (H).pdf
Edexcel GCSE Maths - Cumulative Frequency Diagrams (H) PhysicsAndMathsTutor.com
1. The table shows information about the heights of 40 bushes.
Height (h cm) Frequency
170 ≤ h < 175 5
175 ≤ h < 180 18
180 ≤ h < 185 12
185 ≤ h < 190 4
190 ≤ h < 195 1
(a) Complete the cumulative frequency table.
Height Cumulative
(h cm) Frequency
170 ≤ h < 175
170 ≤ h < 180
170 ≤ h < 185
170 ≤ h < 190
170 ≤ h < 195
(1)
Edexcel Internal Review 1
Cumulative Frequency Diagrams (H).pdf Cumulative Frequency Diagrams (H).pdf Cumulative Frequency Diagrams (H).pdf
, Cumulative Frequency Diagrams (H).pdf)*#$)(&)(*#%)(*_#%()J$YM(%)U$I^__O%$II)(UI#_%K#+_)+_%O_@(UJ))(O#_@$+_
Cumulative Frequency Diagrams (H).pdf Cumulative Frequency Diagrams (H).pdf
Edexcel GCSE Maths - Cumulative Frequency Diagrams (H) PhysicsAndMathsTutor.com
(b) On the grid, draw a cumulative frequency graph for your table.
40
Cumulative
frequency
30
20
10
0
170 175 180 185 190 195
Height (h cm)
(2)
(c) Use the graph to find an estimate for the median height of the bushes.
……………………… cm
(1)
(Total 4 marks)
Edexcel Internal Review 2
Cumulative Frequency Diagrams (H).pdf Cumulative Frequency Diagrams (H).pdf Cumulative Frequency Diagrams (H).pdf
, Cumulative Frequency Diagrams (H).pdf)*#$)(&)(*#%)(*_#%()J$YM(%)U$I^__O%$II)(UI#_%K#+_)+_%O_@(UJ))(O#_@$+_
Cumulative Frequency Diagrams (H).pdf Cumulative Frequency Diagrams (H).pdf
Edexcel GCSE Maths - Cumulative Frequency Diagrams (H) PhysicsAndMathsTutor.com
2. 40 boys each completed a puzzle.
The cumulative frequency graph below gives information about the times it took them to
complete the puzzle.
(a) Use the graph to find an estimate for the median time
............... seconds
(1)
40
Cumulative 30
frequency
20
10
O 10 20 30 40 50 60
Time in seconds
For the boys
the minimum time to complete the puzzle was 9 seconds
and the maximum time to complete the puzzle was 57 seconds.
(b) Use this information and the cumulative frequency graph to draw a box plot showing
information about the boy’s times.
0 10 20 30 40 50 60
Time in seconds
(3)
Edexcel Internal Review 3
Cumulative Frequency Diagrams (H).pdf Cumulative Frequency Diagrams (H).pdf Cumulative Frequency Diagrams (H).pdf
, Cumulative Frequency Diagrams (H).pdf)*#$)(&)(*#%)(*_#%()J$YM(%)U$I^__O%$II)(UI#_%K#+_)+_%O_@(UJ))(O#_@$+_
Cumulative Frequency Diagrams (H).pdf Cumulative Frequency Diagrams (H).pdf
Edexcel GCSE Maths - Cumulative Frequency Diagrams (H) PhysicsAndMathsTutor.com
The box plot below shows information about the times taken by 40 girls to complete the
same puzzle.
0 10 20 30 40 50 60
Time in seconds
(c) Make two comparisons between the boys’ times and the girls’ times.
...............................................................................................................................................
...............................................................................................................................................
(2)
(Total 6 marks)
3. The table gives information about the ages of 160 employees of an IT company.
Age (A) in years Frequency
15 < A ≤ 25 44
25 < A ≤ 35 56
35 < A ≤ 45 34
45 < A ≤ 55 19
55 < A ≤ 65 7
(a) Write down the modal class interval.
.......................................
(1)
(b) Complete the cumulative frequency table.
Age (A) in years Cumulative Frequency
15 < A ≤ 25
15 < A ≤ 35
15 < A ≤ 45
15 < A ≤ 55
Edexcel Internal Review 4
Cumulative Frequency Diagrams (H).pdf Cumulative Frequency Diagrams (H).pdf Cumulative Frequency Diagrams (H).pdf


