Package deal
MATH 225N Complete Week 8 (Bundle)
MATH 225N Complete Week 8 (Bundle)
[Show more]MATH 225N Complete Week 8 (Bundle)
[Show more]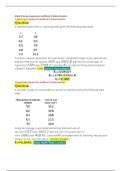
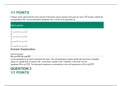
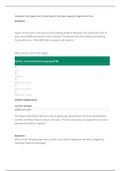
1. Question: A medical experiment on tumor growth gives the following data table……… The least squares regression line was found. Using technology, it was determined that the total sum of squares (SST) was 3922.8 and the sum of squares of regression (SSR) was 3789.0. Calculate R2, rounded to th...
Preview 1 out of 3 pages
Add to cart1. Question: A medical experiment on tumor growth gives the following data table……… The least squares regression line was found. Using technology, it was determined that the total sum of squares (SST) was 3922.8 and the sum of squares of regression (SSR) was 3789.0. Calculate R2, rounded to th...
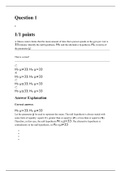
1. Question: A plot of time versus the price of a best-selling model of television has horizontal units of years since 2000 and vertical units of dollars. The best fit line of the data are defined by the equation y=−75x+550, where x=year and y=price. 2. Question: Which of the following data sets ...
Preview 2 out of 12 pages
Add to cart1. Question: A plot of time versus the price of a best-selling model of television has horizontal units of years since 2000 and vertical units of dollars. The best fit line of the data are defined by the equation y=−75x+550, where x=year and y=price. 2. Question: Which of the following data sets ...
1x sold
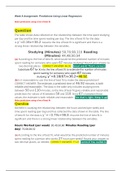
Required Resources Read/review the following resources for this activity: Textbook: Chapter 13 Lesson Minimum of 1 scholarly source In your reference for this assignment, be sure to include both your text/class materials AND your outside reading(s). Initial Post Instructions If a regress...
Preview 1 out of 2 pages
Add to cartRequired Resources Read/review the following resources for this activity: Textbook: Chapter 13 Lesson Minimum of 1 scholarly source In your reference for this assignment, be sure to include both your text/class materials AND your outside reading(s). Initial Post Instructions If a regress...
1x sold
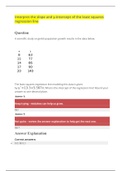
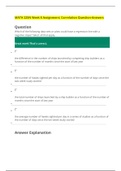
1. Question: The table below shows data on annual expenditure, x (in dollars), on recreation and annual income, y (in dollars), of 20 families. Use Excel to find the best fit linear regression equation. Round the slope and intercept to the nearest integer. 2. Question: An economist is studying the ...
Preview 2 out of 12 pages
Add to cart1. Question: The table below shows data on annual expenditure, x (in dollars), on recreation and annual income, y (in dollars), of 20 families. Use Excel to find the best fit linear regression equation. Round the slope and intercept to the nearest integer. 2. Question: An economist is studying the ...
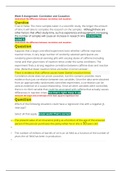
If a regression analysis was to be completed on body mass index (BMI), what could be an independent variable in that analysis? Why? If we could, what other independent variables should be included in the analysis? What statistic(s) would show the value of that regression in understanding BMI?
Preview 1 out of 2 pages
Add to cartIf a regression analysis was to be completed on body mass index (BMI), what could be an independent variable in that analysis? Why? If we could, what other independent variables should be included in the analysis? What statistic(s) would show the value of that regression in understanding BMI?
1. Question: True or False: The more samples taken in a scientific study, the longer the amount of time it will take to complete the research on the samples.Although there are other factors that affect study time, such as experience and equipment, increasing the number of samples will cause an incre...
Preview 1 out of 4 pages
Add to cart1. Question: True or False: The more samples taken in a scientific study, the longer the amount of time it will take to complete the research on the samples.Although there are other factors that affect study time, such as experience and equipment, increasing the number of samples will cause an incre...
1. Question: Which of the following data sets or plots could have a regression line with a negative slope? Select all that apply. 2. Question: The scatter plot below shows the average cost of a designer jacket in a sample of years between 2000 and 2015. The least squares regression line modeling th...
Preview 3 out of 23 pages
Add to cart1. Question: Which of the following data sets or plots could have a regression line with a negative slope? Select all that apply. 2. Question: The scatter plot below shows the average cost of a designer jacket in a sample of years between 2000 and 2015. The least squares regression line modeling th...
1. Question: A survey regarding truck engines found a positive correlation between the size of the engine and horsepower the engine produces. Answer the following question based only on this information. 2. Question: In studying the relationship between income and time spent exercising, suppose y...
Preview 2 out of 14 pages
Add to cart1. Question: A survey regarding truck engines found a positive correlation between the size of the engine and horsepower the engine produces. Answer the following question based only on this information. 2. Question: In studying the relationship between income and time spent exercising, suppose y...
1x sold
1. Question: A fitness center claims that the mean amount of time that a person spends at the gym per visit is 33 minutes. Identify the null hypothesis, H0, and the alternative hypothesis, Ha, in terms of the parameter μ. 2. Question: The answer choices below represent different hypothesis tests. ...
Preview 1 out of 81 pages
Add to cart1. Question: A fitness center claims that the mean amount of time that a person spends at the gym per visit is 33 minutes. Identify the null hypothesis, H0, and the alternative hypothesis, Ha, in terms of the parameter μ. 2. Question: The answer choices below represent different hypothesis tests. ...
1. Question: A fitness center claims that the mean amount of time that a person spends at the gym per visit is 33 minutes. Identify the null hypothesis, H0, and the alternative hypothesis, Ha, in terms of the parameter μ. 2. Question: The answer choices below represent different hypothesis tests. ...
Preview 3 out of 18 pages
Add to cart1. Question: A fitness center claims that the mean amount of time that a person spends at the gym per visit is 33 minutes. Identify the null hypothesis, H0, and the alternative hypothesis, Ha, in terms of the parameter μ. 2. Question: The answer choices below represent different hypothesis tests. ...
1. Question: Annie owns a tutoring service. For each tutoring session, she charges $75 plus $35 per hour of work. A linear equation that expresses the total amount of money Annie earns per tutoring session is y=75+35x. What are the independent and dependent variables? What is the y-intercept and the...
Preview 1 out of 8 pages
Add to cart1. Question: Annie owns a tutoring service. For each tutoring session, she charges $75 plus $35 per hour of work. A linear equation that expresses the total amount of money Annie earns per tutoring session is y=75+35x. What are the independent and dependent variables? What is the y-intercept and the...
1. Question: The table shows data collected on the relationship between the time spent studying per day and the time spent reading per day. The line of best fit for the data is yˆ=0.16x+36.2. Assume the line of best fit is significant and there is a strong linear relationship between the variables....
Preview 1 out of 29 pages
Add to cart1. Question: The table shows data collected on the relationship between the time spent studying per day and the time spent reading per day. The line of best fit for the data is yˆ=0.16x+36.2. Assume the line of best fit is significant and there is a strong linear relationship between the variables....
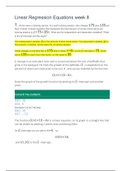
Performing Linear Regressions with Technology Question: An amateur astronomer is researching statistical properties of known stars using a variety of databases. They collect the absolute magnitude or MV and stellar mass or M for 30 stars. The absolute magnitude of a star is the intensity of light t...
Preview 1 out of 54 pages
Add to cartPerforming Linear Regressions with Technology Question: An amateur astronomer is researching statistical properties of known stars using a variety of databases. They collect the absolute magnitude or MV and stellar mass or M for 30 stars. The absolute magnitude of a star is the intensity of light t...
Preview 1 out of 6 pages
Add to cartMATH 225N Week 8 Correlation and Bivariate
1. Question: A plot of time versus the price of a best-selling model of television has horizontal units of years since 2000 and vertical units of dollars. The best fit line of the data are defined by the equation y=−75x+550, where x=year and y=price. 2. Question: Which of the following data sets ...
Preview 1 out of 9 pages
Add to cart1. Question: A plot of time versus the price of a best-selling model of television has horizontal units of years since 2000 and vertical units of dollars. The best fit line of the data are defined by the equation y=−75x+550, where x=year and y=price. 2. Question: Which of the following data sets ...

Stuvia customers have reviewed more than 700,000 summaries. This how you know that you are buying the best documents.

You can quickly pay through credit card or Stuvia-credit for the summaries. There is no membership needed.

Your fellow students write the study notes themselves, which is why the documents are always reliable and up-to-date. This ensures you quickly get to the core!
You get a PDF, available immediately after your purchase. The purchased document is accessible anytime, anywhere and indefinitely through your profile.
Our satisfaction guarantee ensures that you always find a study document that suits you well. You fill out a form, and our customer service team takes care of the rest.
Stuvia is a marketplace, so you are not buying this document from us, but from seller Milestonee. Stuvia facilitates payment to the seller.
No, you only buy these notes for $127.97. You're not tied to anything after your purchase.
4.6 stars on Google & Trustpilot (+1000 reviews)
97168 documents were sold in the last 30 days
Founded in 2010, the go-to place to buy study notes for 14 years now