

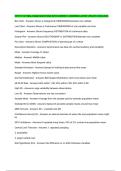
HPHY 212 FINAL EXAM QUESTIONS WITH CORRECT ANSWERS LATEST UPDATE 2025/2026
Bar Chart - Answers shows a Categorical COMPARISON between one varibale
Line Chart - Answers Shows a Continuous COMPARISON of one variable over time
Histogram - Answers Shows frequency DISTRIBUTION of continuous data
Scatter Plot - Answers Shows RELATIONSHIP or DISTRIBUTION between two variables
Pie Chart - Answers Shows COMPOSITION of percent/part of a whole
Descriptive Statistics - Answers Summarizes raw data into central tendency and variability
Mean - Answers Average of values
Median - Answers Middle value
Mode - Answers Most frequent value
Standard Deviation - Answers Spread of individual data around the mean
Range - Answers Highest minus lowest value
Normal Distribution - Answers Bell-shaped distribution with most values near mean
68-95-99 Rule - Answers 68% within 1 SD, 95% within 2 SD, 99% within 3 SD
High SD - Answers Large variability between observations
Low SD - Answers Observations are very consistent
Sample Mean - Answers Average from the sample used to estimate population mean
Standard Error (SEM) - Answers Spread of possible sample means around true mean
SEM Formula - Answers SD ÷ √sample size (N)
Confidence Interval (CI) - Answers an interval estimate of where the true population mean might
lie
95% Confidence - Answers If repeated many times, 95% of CI's contain true population mean
Central Limit Theorem - Answers 1. repeated sampling
2. probability
3. larger sample size
Null Hypothesis (Ho) - Answers No difference or no effect between variables
, Alternative Hypothesis (Ha) - Answers There is a difference or effect between variables
Alpha (α) - Answers Threshold probability for rejecting Ho (usually 0.05)
P-value - Answers Probability of observing data if Ho is true
Reject Ho - Answers Evidence suggests a real difference (p < α)
Fail to Reject Ho - Answers No evidence of a difference (p ≥ α)
One-tailed Test - Answers Directional hypothesis (> or <): we are prediciting it is only greater or
only less than the mean in our hypothesis
Two-tailed Test - Answers Non-directional hypothesis
T-test - Answers Compares means between two groups
ANOVA - Answers Compares means across 3 or more groups
Significant ANOVA - Answers Result shows at least one mean difference but not which groups
differ
Post-hoc Test - Answers Follow-up tests after ANOVA to find specific group differences
Bonferroni Correction - Answers Adjusts alpha to reduce false positives
Correlation (r) - Answers Strength and direction of a relationship (measure association between
2 variables)
r Strength Scale - Answers Weak = 0-0.3, Moderate = 0.3-0.7, Strong = 0.7-1.0
Positive r - Answers Both variables increase together
Negative r - Answers One increases, the other decreases
Coefficient of Determination (r²) - Answers The percent of Y (DV) changes that can be explained
by the chnages in X (IV)
Type I Error (α) - Answers False positive: says there is a difference when there is no difference
Type II Error (β) - Answers False negative: says there is no difference when there is a difference
Power (1 - β) - Answers Probability that hypothesis test detects a real difference when a
difference exists
High Power - Answers Easier to detect true effects; fewer Type II errors
Low Power - Answers Harder to detect true effects; more Type II errors
Bar Chart - Answers shows a Categorical COMPARISON between one varibale
Line Chart - Answers Shows a Continuous COMPARISON of one variable over time
Histogram - Answers Shows frequency DISTRIBUTION of continuous data
Scatter Plot - Answers Shows RELATIONSHIP or DISTRIBUTION between two variables
Pie Chart - Answers Shows COMPOSITION of percent/part of a whole
Descriptive Statistics - Answers Summarizes raw data into central tendency and variability
Mean - Answers Average of values
Median - Answers Middle value
Mode - Answers Most frequent value
Standard Deviation - Answers Spread of individual data around the mean
Range - Answers Highest minus lowest value
Normal Distribution - Answers Bell-shaped distribution with most values near mean
68-95-99 Rule - Answers 68% within 1 SD, 95% within 2 SD, 99% within 3 SD
High SD - Answers Large variability between observations
Low SD - Answers Observations are very consistent
Sample Mean - Answers Average from the sample used to estimate population mean
Standard Error (SEM) - Answers Spread of possible sample means around true mean
SEM Formula - Answers SD ÷ √sample size (N)
Confidence Interval (CI) - Answers an interval estimate of where the true population mean might
lie
95% Confidence - Answers If repeated many times, 95% of CI's contain true population mean
Central Limit Theorem - Answers 1. repeated sampling
2. probability
3. larger sample size
Null Hypothesis (Ho) - Answers No difference or no effect between variables
, Alternative Hypothesis (Ha) - Answers There is a difference or effect between variables
Alpha (α) - Answers Threshold probability for rejecting Ho (usually 0.05)
P-value - Answers Probability of observing data if Ho is true
Reject Ho - Answers Evidence suggests a real difference (p < α)
Fail to Reject Ho - Answers No evidence of a difference (p ≥ α)
One-tailed Test - Answers Directional hypothesis (> or <): we are prediciting it is only greater or
only less than the mean in our hypothesis
Two-tailed Test - Answers Non-directional hypothesis
T-test - Answers Compares means between two groups
ANOVA - Answers Compares means across 3 or more groups
Significant ANOVA - Answers Result shows at least one mean difference but not which groups
differ
Post-hoc Test - Answers Follow-up tests after ANOVA to find specific group differences
Bonferroni Correction - Answers Adjusts alpha to reduce false positives
Correlation (r) - Answers Strength and direction of a relationship (measure association between
2 variables)
r Strength Scale - Answers Weak = 0-0.3, Moderate = 0.3-0.7, Strong = 0.7-1.0
Positive r - Answers Both variables increase together
Negative r - Answers One increases, the other decreases
Coefficient of Determination (r²) - Answers The percent of Y (DV) changes that can be explained
by the chnages in X (IV)
Type I Error (α) - Answers False positive: says there is a difference when there is no difference
Type II Error (β) - Answers False negative: says there is no difference when there is a difference
Power (1 - β) - Answers Probability that hypothesis test detects a real difference when a
difference exists
High Power - Answers Easier to detect true effects; fewer Type II errors
Low Power - Answers Harder to detect true effects; more Type II errors



