
• Verkeerd document? Gratis ruilen
  • Geschreven door studenten die geslaagd zijn
  • Direct beschikbaar na je betaling
  • Online lezen of als PDF
Verkopen
Kies je studieland
Kies je taal
Document preview thumbnail
Voorbeeld 1 van de 4 pagina's
Tentamen (uitwerkingen)

Six Sigma- Yellow Belt Exam A+ Pass 2025 New Update

Document preview thumbnail
Voorbeeld 1 van de 4 pagina's

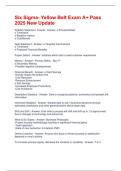
Six Sigma- Yellow Belt Exam A+ Pass 2025 New Update Problem Statement- Include - Answer- o Process/Defect o Timeframe o Baseline metrics o Cost/Benefit Goal Statement - Answer- o Targeted Improvement o Timeframe o Projected Financial Benefits Project Defect - Answer- Instance which fails to meet customer requirement Metrics - Answer- -Primary Metric - Big "Y" o Secondary Metrics Possible negative consequences Financial Benefit - Answer- o Hard Savings Directly Impact the bottom line Cost Reduction Revenue Enhancement o Soft Savings Increased Employee Productivity Cost Avoidance Descriptive Statistics - Answer- Data to recognize patterns, summarize and present the information Inferential Statistics - Answer- Sample data to aid in business decisions through estimates, predictions and other generalizations about larger data Shift and Drift - Answer- Over time a process will shift and drift up to 1.5 sigma levels due to changes in technology and personnel. What is Six Sigma - Answer- Business Philosophy -Project focused methodology resulting in significant financial gains -Team approach -State of near perfection 3.4 defects PMO Define Customer - Answer- Anyone who buys or whose success or satisfaction depends on one's actions To increase process sigma, decrease the variation or variability - Answer- T or F True What are the basic principles of data collection - Answer- Observe first, then measure Know the data type Measure for a reason Have a measurement process Develop a sampling scheme What are the types of data and describe the characteristics associated with each - Answer- Continuous or Variable Infinitely Divisible Continuum Half Test Discrete or Attribute Has Clear Boundaries Can be sorted What are the areas of statistics and describe the characteristics associated with each - Answer- Descriptive - Used to recognize patterns Inferential - Uses sample data to aid with business decisions through estimates. What is the difference between population and sample - Answer- Population is every possible observation or census. Sample is a subset of the population. What is a Pareto chart and why is it used - Answer- Measure phase to determine the 80/20 rule Which inputs have the greatest effect Determine the X's for the project focus Prioritizing design elements for DFSS What are the descriptive statistical measures of central tendency and describe each - Answer- Mean - Average Median - 50/50 split Mode - Value that occurs the most often What are the descriptive statistical measures of dispersion and describe each - Answer- Range - Distance between the extreme values Deviation - Distance between sample value and the average Variance - Measure of the variation around the mean in squared units Standard Deviation - Measure of the variation around the mean What is the difference between Sigma and Process Sigma - Answer- Process Sigma measure the capability of the process to perform defect free work and detect how well the process is performing. Sigma is Process Standard Deviation. D in DMAIC= - Answer- • Define o Project Definition o Five Sources of Opportunity Strategic Objectives • CTB Trees VOC - Voice of Customer • Kano Model o Must Be o More is Better o Delighters Benchmarking • Industry Standard • Best Practices COPQ • Any cost that would not have been incurred if quality were perfect Hidden Factory • Rolled Throughput Yield M in DMAIC - Answer- • Measure - data collection, measuring current process o SIPOC / SIPOC Plus Graphical representation of current process o Project Drill Down Tree o Data Collection Normal versus non-normal Discrete-attribute / Continuious-variable o Basic Statistics - Graphical Summary Anderson Darling normality test o Pareto 80/20 o Process Capability Z Bench Normal versus non-normal o Sigma Conversion Tool o FMEA o Minitab A in DMAIC - Answer- • Analyze - Root causes o Cause and Effect Diagram; Ishikawa, Fishbone o Affinity Diagram o 5 whys Inch wide, mile deep Drill down to the root cause o Interrelations Diagram Determine if the root cause is really an effect of another root cause The most out arrows is a root cause

Voorbeeld van de inhoud

Six Sigma- Yellow Belt Exam A+ Pass
2025 New Update
Problem Statement- Include - Answer- o Process/Defect
o Timeframe
o Baseline metrics
o Cost/Benefit

Goal Statement - Answer- o Targeted Improvement
o Timeframe
o Projected Financial Benefits

Project Defect - Answer- Instance which fails to meet customer requirement

Metrics - Answer- -Primary Metric - Big "Y"
o Secondary Metrics
Possible negative consequences

Financial Benefit - Answer- o Hard Savings
Directly Impact the bottom line
Cost Reduction
Revenue Enhancement
o Soft Savings
Increased Employee Productivity
Cost Avoidance

Descriptive Statistics - Answer- Data to recognize patterns, summarize and present the
information

Inferential Statistics - Answer- Sample data to aid in business decisions through
estimates, predictions and other generalizations about larger data

Shift and Drift - Answer- Over time a process will shift and drift up to 1.5 sigma levels
due to changes in technology and personnel.

What is Six Sigma - Answer- Business Philosophy
-Project focused methodology resulting in significant financial gains
-Team approach
-State of near perfection 3.4 defects PMO

Define Customer - Answer- Anyone who buys or whose success or satisfaction
depends on one's actions

To increase process sigma, decrease the variation or variability - Answer- T or F

Documentinformatie

Geüpload op
22 oktober 2025
Aantal pagina's
4
Geschreven in
2025/2026
Type
Tentamen (uitwerkingen)
Bevat
Vragen en antwoorden
€11,48

Verkeerd document? Gratis ruilen Binnen 14 dagen na aankoop en voor het downloaden kun je een ander document kiezen. Je kunt het bedrag gewoon opnieuw besteden.
Geschreven door studenten die geslaagd zijn
Direct beschikbaar na je betaling
Online lezen of als PDF

Seller avatar
De reputatie van een verkoper is gebaseerd op het aantal documenten dat iemand tegen betaling verkocht heeft en de beoordelingen die voor die items ontvangen zijn. Er zijn drie niveau’s te onderscheiden: brons, zilver en goud. Hoe beter de reputatie, hoe meer de kwaliteit van zijn of haar werk te vertrouwen is.
ScholarExams
3,8
(75)
Verkocht
400
Volgers
186
Items
11787
Laatst verkocht
4 dagen geleden

Echte notities, van echte studenten
Elk document op Stuvia is geschreven door een medestudent die hetzelfde vak deed. Zo leer je van iemand die het al heeft gehaald.


Waarom studenten kiezen voor Stuvia

Gemaakt door medestudenten, geverifieerd door reviews

Kwaliteit die je kunt vertrouwen: geschreven door studenten die slaagden en beoordeeld door anderen die dit document gebruikten.

Niet tevreden? Kies een ander document

Geen zorgen! Je kunt voor hetzelfde geld direct een ander document kiezen dat beter past bij wat je zoekt.

Betaal zoals je wilt, start meteen met leren

Geen abonnement, geen verplichtingen. Betaal zoals je gewend bent via iDeal of creditcard en download je PDF-document meteen.

Student with book image

“Gekocht, gedownload en geslaagd. Zo makkelijk kan het dus zijn.”

Alisha Student

Bezig met je bronvermelding?

Maak nauwkeurige citaten in APA, MLA en Harvard met onze gratis bronnengenerator.

Bezig met je bronvermelding?

Veelgestelde vragen

