Week 1
Six equations to help conceptualize the field of Mixed Methods
When mixed methods were described as ‘1 + 1 = 3’, there was some criticism. Mentioned was that
mixed methods were more than could be expressed in this single equation. This research tries to
think further about how additional equations might help conceptualize the field. In the interest of
providing an ‘equation framework’ to help conceptualize some of the compelling issues in the field of
mixed methods, the following six equations are offered:
1 + 1 = 1 Mixed methods is a novel third methodology distinct from qualitative and quantitative
methodologies.
1 + 1 = 2 Conducting mixed qualitative and quantitative data collection without integration sum is no
more than the independent parts.
1 + 1 = 3 Conducting mixed methods using an integrated approach yields a whole greater than the
sum of the individual parts. This equation is a reminder to mixed methods researchers to seek added
value, and to look for how using qualitative and quantitative methodology together can reap a better
understanding of the whole. Critique: (1) the idea that qualitative and quantitative methodologies
were intended to do different things and that they are incompatible and (2) it will lead to
compromises of the tenets of the paradigm (like certain conditions under which you do research).
1 + 1 = 4 Using qualitative and quantitative methodology as mixed methods research yields four
types of publication opportunities: mixed methods empirical, qualitative empirical, empirical
quantitative, and mixed methodology publications.
1 + 1 = 5 Conducting rigorous mixed methods research often means working in teams with five or
more members, with different expertise (expertise in mixed methods research methodology, content
expert, qualitative expert, quantitative expert, various types of support staff used to conduct mixed
method projects).
1 + 1 = infinite There are countless possibilities for integrating qualitative and quantitative
procedures together in mixed methods programs of research.
Research design: the methodology for interdisciplinary research
framework
Interdisciplinary research: any study or group of studies undertaken by scholars from two or more
distinct scientific disciplines. The research is based upon a conceptual model that links or integrates
theoretical frameworks from those disciplines, uses study design and methodology that is not limited
to any one field, and requires the use of perspectives and skills of the involved disciplines throughout
multiple phases of the research process.
However, interdisciplinary research is seen as a challenge. Four critical factors for success or failure in
natural-social science collaboration were identified: (1) the paradigms or epistemologies in the
current (mono-disciplinary) sciences, (2) the skills and competences of the scientists involved, (3) the
institutional context of the research, and (4) the organization of collaborations.
The framework for Methodology in Interdisciplinary Research (MIR framework) aspires to
contribute to the critical factor skills and competences for social and natural sciences collaboration.
The MIR framework was built on the process approach, because the research question or hypothesis
is leading for all decisions in the various stages of research. The MIR framework also introduces an
agenda: the research team needs to carefully think about the conceptual design (‘why’ and ‘what’ of
the research) and the technical design (‘how’) of their study before starting its execution. Whereas
the conceptual and technical design are by definition interdisciplinary team work, the respective
team members may do their (mono)disciplinary parts of fieldwork and data analysis on a modular
basis.
1
,Conceptual design: The conceptual design includes mostly activities such as thinking, exchanging,
interdisciplinary knowledge, reading and discussing. The conceptual framework comprises the
research objective (what is to be achieved by the research; mostly requested by the commissioner or
funding agency), the theories central in the research project, the research questions and the
operationalization of constructs and concepts (general notions or ideas based on theory or common
sense that are multifaceted and not directly visible or measurable).
Technical design: The technical design addresses the issues ‘how, where and when will research units
be studied’ (study design), ‘how will measurement proceed’ (instrument selection or design), ‘how
and how many research units will be recruited (‘sampling plan), ‘how will collected data be analyzed
and synthesized’ (analysis plan). Typical study designs for descriptive research questions and
research questions on associations are the cross-sectional study design, longitudinal study design are
required to investigate development over time and cause-effect relationships are studied in
experiments. Phenomenological questions concern a phenomenon about which little is known, you
study it in its own environment (case study design). Furthermore, it is important to consider the role
of the researcher in the study (often a source of misunderstanding in interdisciplinary teams).
Integration: Although the MIR framework has not been designed with the intention to promote
mixed methods research, it is suitable for the design of mixed methods research as the kind of
research that calls for both quantitative and qualitative components.
Scientific quality and ethical considerations: Ethical issues run through all components in the MIR
framework. Different terms are used for the assessment of scientific quality of research:
Internal validity: Internal validity is the extent to which the experiment is free from errors
and any difference in measurement is due to independent variables and nothing else.
External validity: External validity is the extent to which the research results can be inferred
to the world at large.
Measurement validity: Measuring what it is supposed to measure.
Reliability: The overall consistency of a measure. A measure is said to have a high reliability if
it produces similar results under consistent conditions.
Source triangulation: Refers to the use of multiple methods sources to develop a
comprehensive understanding of the same phenomenon.
Measurement triangulation: Refers to the use of multiple data sources to develop a
comprehensive understanding of the same phenomenon.
Limitations: The limitations of the MIR framework are those of any kind of collaboration: it cannot
work wonders in the absence of awareness of the necessity and it requires the willingness to work,
learn, and research together. The MIR framework hasn’t been formally evaluated and compared in
an experiment.
Week 2
Field: Chapter 8 Regression (short summary)
Regression analysis is a set of statistical processes for estimating the relationships between a
dependent variable (outcome variable; continuous scale) and one or more independent variables
(predictors; continuous or categorical scale). The most common form of regression analysis is
(multiple) linear regression, in which a researcher finds the line (or a more complex linear
combination) that most closely fits the data according to a specific mathematical criterion. We
typically use the method of least squares. The least squares method is a statistical procedure to find
the best fit for a set of data points by minimizing the sum of the residuals of points from the plotted
curve.
Assumptions of the linear model:
2
, - Additivity and linearity: There exists a linear relationship between the independent variable,
x, and the dependent variable, y
- Independent errors: The residuals are independent. For any observations the residual terms
should be uncorrelated. This assumption can be tested with the Durbin-Watson test.
- Homoscedasticity: At each level of the predictor variable(s), the variance of the residual
terms should be constant.
- Normally distributed errors: It is assumed that the residuals in the model are random,
normally distributed with a mean of 0. (Don’t confuse this assumption with the idea that
predictors have to be normally distributed, this is not true).
- Predictors are uncorrelated with ‘external variables’: External variables are variables that
haven’t been included in the regression model and that influence the outcome variable.
There should be no external variables that correlated with any of the variables included in
the regression model.
- Variable types: All predictor variables must be at interval or categorical level, and the
outcome variable must be at interval or ratio level.
- No perfect multicollinearity: The predictor variables should not correlate too highly.
- Non-zero variance: The predictors should have some variation in value.
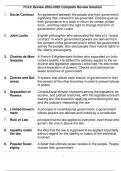
The formula for a multiple linear regression is:
- y = the predicted value of the dependent variable
- B0 = the y-intercept (value of y when all other parameters are set to 0)
- B1X1= the regression coefficient (B1) of the first independent variable (X1) (a.k.a. the effect
that increasing the value of the independent variable has on the predicted y value)
- … = do the same for however many independent variables you are testing
- BnXn = the regression coefficient of the last independent variable
- e = model error (a.k.a. how much variation there is in our estimate of y)
When measuring how good the line fit, the statistical measure R-squared is used to measure how
close the data are to the fitted regression line. It is also known as the coefficient of determination, or
the coefficient of multiple determination for multiple regression. 100% indicates that the model
explains all the variability of the response data around its mean.
Field: Chapter 18 Categorical data (short summary)
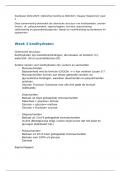
A contingency table (also known as a cross tabulation or crosstab) is a type of table in a matrix
format that displays the (multivariate) frequency distribution of the variables. This contingency table
is used to measure if there is a relationship between two categorical variables. We measure this with
two statistical tests:
- Chi-square test: This is based on the idea of comparing the frequencies you observe in
certain categories to the frequencies you might expect to get in those categories by chance.
It is important to use a large sample (expected frequencies greater than 5, otherwise use a
Fisher’s exact test).
- Likelihood ratio (alternative): This is based on the maximum-likelihood theory. The general
idea behind this theory is that you collect some data and create a model for which the
probability of obtaining the observed set of data is maximized, then you compare this model
to the probability of obtaining those data under the null hypothesis.
Assumptions that are important when analyzing categorical data with a chi-square test:
3
Six equations to help conceptualize the field of Mixed Methods
When mixed methods were described as ‘1 + 1 = 3’, there was some criticism. Mentioned was that
mixed methods were more than could be expressed in this single equation. This research tries to
think further about how additional equations might help conceptualize the field. In the interest of
providing an ‘equation framework’ to help conceptualize some of the compelling issues in the field of
mixed methods, the following six equations are offered:
1 + 1 = 1 Mixed methods is a novel third methodology distinct from qualitative and quantitative
methodologies.
1 + 1 = 2 Conducting mixed qualitative and quantitative data collection without integration sum is no
more than the independent parts.
1 + 1 = 3 Conducting mixed methods using an integrated approach yields a whole greater than the
sum of the individual parts. This equation is a reminder to mixed methods researchers to seek added
value, and to look for how using qualitative and quantitative methodology together can reap a better
understanding of the whole. Critique: (1) the idea that qualitative and quantitative methodologies
were intended to do different things and that they are incompatible and (2) it will lead to
compromises of the tenets of the paradigm (like certain conditions under which you do research).
1 + 1 = 4 Using qualitative and quantitative methodology as mixed methods research yields four
types of publication opportunities: mixed methods empirical, qualitative empirical, empirical
quantitative, and mixed methodology publications.
1 + 1 = 5 Conducting rigorous mixed methods research often means working in teams with five or
more members, with different expertise (expertise in mixed methods research methodology, content
expert, qualitative expert, quantitative expert, various types of support staff used to conduct mixed
method projects).
1 + 1 = infinite There are countless possibilities for integrating qualitative and quantitative
procedures together in mixed methods programs of research.
Research design: the methodology for interdisciplinary research
framework
Interdisciplinary research: any study or group of studies undertaken by scholars from two or more
distinct scientific disciplines. The research is based upon a conceptual model that links or integrates
theoretical frameworks from those disciplines, uses study design and methodology that is not limited
to any one field, and requires the use of perspectives and skills of the involved disciplines throughout
multiple phases of the research process.
However, interdisciplinary research is seen as a challenge. Four critical factors for success or failure in
natural-social science collaboration were identified: (1) the paradigms or epistemologies in the
current (mono-disciplinary) sciences, (2) the skills and competences of the scientists involved, (3) the
institutional context of the research, and (4) the organization of collaborations.
The framework for Methodology in Interdisciplinary Research (MIR framework) aspires to
contribute to the critical factor skills and competences for social and natural sciences collaboration.
The MIR framework was built on the process approach, because the research question or hypothesis
is leading for all decisions in the various stages of research. The MIR framework also introduces an
agenda: the research team needs to carefully think about the conceptual design (‘why’ and ‘what’ of
the research) and the technical design (‘how’) of their study before starting its execution. Whereas
the conceptual and technical design are by definition interdisciplinary team work, the respective
team members may do their (mono)disciplinary parts of fieldwork and data analysis on a modular
basis.
1
,Conceptual design: The conceptual design includes mostly activities such as thinking, exchanging,
interdisciplinary knowledge, reading and discussing. The conceptual framework comprises the
research objective (what is to be achieved by the research; mostly requested by the commissioner or
funding agency), the theories central in the research project, the research questions and the
operationalization of constructs and concepts (general notions or ideas based on theory or common
sense that are multifaceted and not directly visible or measurable).
Technical design: The technical design addresses the issues ‘how, where and when will research units
be studied’ (study design), ‘how will measurement proceed’ (instrument selection or design), ‘how
and how many research units will be recruited (‘sampling plan), ‘how will collected data be analyzed
and synthesized’ (analysis plan). Typical study designs for descriptive research questions and
research questions on associations are the cross-sectional study design, longitudinal study design are
required to investigate development over time and cause-effect relationships are studied in
experiments. Phenomenological questions concern a phenomenon about which little is known, you
study it in its own environment (case study design). Furthermore, it is important to consider the role
of the researcher in the study (often a source of misunderstanding in interdisciplinary teams).
Integration: Although the MIR framework has not been designed with the intention to promote
mixed methods research, it is suitable for the design of mixed methods research as the kind of
research that calls for both quantitative and qualitative components.
Scientific quality and ethical considerations: Ethical issues run through all components in the MIR
framework. Different terms are used for the assessment of scientific quality of research:
Internal validity: Internal validity is the extent to which the experiment is free from errors
and any difference in measurement is due to independent variables and nothing else.
External validity: External validity is the extent to which the research results can be inferred
to the world at large.
Measurement validity: Measuring what it is supposed to measure.
Reliability: The overall consistency of a measure. A measure is said to have a high reliability if
it produces similar results under consistent conditions.
Source triangulation: Refers to the use of multiple methods sources to develop a
comprehensive understanding of the same phenomenon.
Measurement triangulation: Refers to the use of multiple data sources to develop a
comprehensive understanding of the same phenomenon.
Limitations: The limitations of the MIR framework are those of any kind of collaboration: it cannot
work wonders in the absence of awareness of the necessity and it requires the willingness to work,
learn, and research together. The MIR framework hasn’t been formally evaluated and compared in
an experiment.
Week 2
Field: Chapter 8 Regression (short summary)
Regression analysis is a set of statistical processes for estimating the relationships between a
dependent variable (outcome variable; continuous scale) and one or more independent variables
(predictors; continuous or categorical scale). The most common form of regression analysis is
(multiple) linear regression, in which a researcher finds the line (or a more complex linear
combination) that most closely fits the data according to a specific mathematical criterion. We
typically use the method of least squares. The least squares method is a statistical procedure to find
the best fit for a set of data points by minimizing the sum of the residuals of points from the plotted
curve.
Assumptions of the linear model:
2
, - Additivity and linearity: There exists a linear relationship between the independent variable,
x, and the dependent variable, y
- Independent errors: The residuals are independent. For any observations the residual terms
should be uncorrelated. This assumption can be tested with the Durbin-Watson test.
- Homoscedasticity: At each level of the predictor variable(s), the variance of the residual
terms should be constant.
- Normally distributed errors: It is assumed that the residuals in the model are random,
normally distributed with a mean of 0. (Don’t confuse this assumption with the idea that
predictors have to be normally distributed, this is not true).
- Predictors are uncorrelated with ‘external variables’: External variables are variables that
haven’t been included in the regression model and that influence the outcome variable.
There should be no external variables that correlated with any of the variables included in
the regression model.
- Variable types: All predictor variables must be at interval or categorical level, and the
outcome variable must be at interval or ratio level.
- No perfect multicollinearity: The predictor variables should not correlate too highly.
- Non-zero variance: The predictors should have some variation in value.
The formula for a multiple linear regression is:
- y = the predicted value of the dependent variable
- B0 = the y-intercept (value of y when all other parameters are set to 0)
- B1X1= the regression coefficient (B1) of the first independent variable (X1) (a.k.a. the effect
that increasing the value of the independent variable has on the predicted y value)
- … = do the same for however many independent variables you are testing
- BnXn = the regression coefficient of the last independent variable
- e = model error (a.k.a. how much variation there is in our estimate of y)
When measuring how good the line fit, the statistical measure R-squared is used to measure how
close the data are to the fitted regression line. It is also known as the coefficient of determination, or
the coefficient of multiple determination for multiple regression. 100% indicates that the model
explains all the variability of the response data around its mean.
Field: Chapter 18 Categorical data (short summary)
A contingency table (also known as a cross tabulation or crosstab) is a type of table in a matrix
format that displays the (multivariate) frequency distribution of the variables. This contingency table
is used to measure if there is a relationship between two categorical variables. We measure this with
two statistical tests:
- Chi-square test: This is based on the idea of comparing the frequencies you observe in
certain categories to the frequencies you might expect to get in those categories by chance.
It is important to use a large sample (expected frequencies greater than 5, otherwise use a
Fisher’s exact test).
- Likelihood ratio (alternative): This is based on the maximum-likelihood theory. The general
idea behind this theory is that you collect some data and create a model for which the
probability of obtaining the observed set of data is maximized, then you compare this model
to the probability of obtaining those data under the null hypothesis.
Assumptions that are important when analyzing categorical data with a chi-square test:
3