

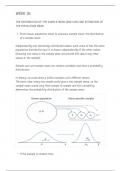
WEEK 3a
THE DISTRIBUTION OF THE SAMPLE MEAN (AND SUM) AND ESTIMATION OF
THE POPULATION MEAN
. From known population mean to unknown sample mean: the distribution
of a sample mean
Independently and identically distributed values: each value Xi has the same
population distribution and it is drawn independently of the other values
(knowing one value in the sample does not provide info about any other
values in the sample)
Sample sum and sample mean are random variables and have a probability
distribution
In theory: we could draw a million samples with different means
The basic idea: every new ample would give a new sample mean, so the
sample mean would vary from sample to sample and this variability
determines the probability distribution of the sample mean
1
– If the sample is random then
, – The spread of the distribution of the sample mean is smaller than the
spread of distribution of value X - then
– The sample mean often has a normal distribution because the sample is
random and X is normally distributed
– The sample is random and n is large (rule of thumb: N≥30) then sample
mean (X-) has a normal distribution
– Central limit theorem = crucial in statistics - the result holds exactly
in the limit when the sample size n goes to infinity
The bigger the sample size the smaller the distribution
. The standard error of the sample and the t-distribution
Variability of sample mean around µ measured by standard deviation- but in
practice σ is known so z-statistic cant be used
So -> measured by the “standard error of the sample mean” - an estimate of
the true variability
THE DISTRIBUTION OF THE SAMPLE MEAN (AND SUM) AND ESTIMATION OF
THE POPULATION MEAN
. From known population mean to unknown sample mean: the distribution
of a sample mean
Independently and identically distributed values: each value Xi has the same
population distribution and it is drawn independently of the other values
(knowing one value in the sample does not provide info about any other
values in the sample)
Sample sum and sample mean are random variables and have a probability
distribution
In theory: we could draw a million samples with different means
The basic idea: every new ample would give a new sample mean, so the
sample mean would vary from sample to sample and this variability
determines the probability distribution of the sample mean
1
– If the sample is random then
, – The spread of the distribution of the sample mean is smaller than the
spread of distribution of value X - then
– The sample mean often has a normal distribution because the sample is
random and X is normally distributed
– The sample is random and n is large (rule of thumb: N≥30) then sample
mean (X-) has a normal distribution
– Central limit theorem = crucial in statistics - the result holds exactly
in the limit when the sample size n goes to infinity
The bigger the sample size the smaller the distribution
. The standard error of the sample and the t-distribution
Variability of sample mean around µ measured by standard deviation- but in
practice σ is known so z-statistic cant be used
So -> measured by the “standard error of the sample mean” - an estimate of
the true variability



