SUMMARY STATISTICS PART 2
Exam 2
LECTURE 9
-Association interval & ordinal variables
Association measures
The smallest rho we can observe is -1 en the biggest +1 so -1 < r, rs, tau > +1
What is covariance?
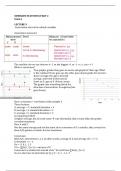
Two graphs: grades they gave to movie and graph for their age. What
is the relation? If one goes up, the other goes down (grade for movie is
above average, the age is beneath
average, mirrored in that sense)
Score on Y, age on X → they covary
The graph says something about the
direction of association → negative (line
goes down)
Now: covariance + correlation with example 2
Three lectures
A; average = 7, standard deviation = 3
B; average = 6, standard deviation = 3
C; average = 6, standard deviation = 2
A comparing with B
A higher average, but sd is the same → vary identically, they covary fully; the grades
correlate maximum
Now A with C
Not the same average and not the same sd so covariance of C is smaller; they covary less
than A/B; grades correlate, but not maximum.
Covariance
With A/C, determine (x-, y-). In other words, average of A and average of C = 7 ; 6
X deviation = x – x-
Dx = -5, 0, 1, 1, 3
S2x = (∑dx)2 / (n-1) = variance of X
Covariance is similar but instead of dx * dx we’ll have ∑dxdy / (n-1)
So you also have to determine dy (y-y-) = -3, 1, -1, 1, 2
,So ∑dxdy = -5 x -3 + 0 x 1 + 1 x -1 + 1 x 1 + 3 x 2
= 21
Then the covariance is 21 / (n-1) = 21/4 = 5,25
So the covariance is kind of a ‘combined’
variance (can be positive or negative and gives
an indication for correlation → negative or
positive association but depends on the scale
you use = scale-sensitive
Therefore, covariance → correlation
R = covariance / sxsy (Standard deviation)
For example above: 5, x 2 = 0,875 (correlation coefficient, 0 = no correlation)
R2 = 0,77 (77% linearly explained)
R = not scale sensitive so you can compare different variables
R = coefficient of linear association (standardized covariance). -1 < r < 1
R = standardized regression coefficient b in case of simple regression (one independent
variable)
R2 = proportion variation in y linearly explained by x
Covariance is not an association measure (Scale sensitive) but we do use it to determine
correlation
Example; r = -0,5
• Negative correlation
• A 1.0 sx increase in x association with a 0,5sy decrease in y
• R2 = 0,25 (25% y-variation linearly explained by x = medium linear association)
Eta vs. r
Eta = more general
Eta2 = proportion variation y explained by x
Eta2 ≥ r2
(Because r2 is linearly explained (so less explained))
Advantage eta
• Variable x; every measurement level
• More general association
Disadvantage
• Less specific. With r, there is a direction
• Eta y on x is not the same as eta x on y (not symmetrical, as is the case with r)
Does the correlation make sense?
Sometimes it is high without making sense. Therefore, base it on existing theories!
Till now: pearson r
R vs. rank correlation, if
• 1 or both variable ordinal measurement level
• Increasing or decreasing, but curved
Advantage = more general useable
Disadvantage = less specific
Rank correlation measures; spearmans rs & Kendall’s tau
First: rank scores
, In our example, x-bar has 2 points on the third
score so 2x 3.5! And the last one 5. Do the same for
y-bar and you’ll have the rank scores!
First: determine covariance = 1,81 (∑dxdy / (n-1))
Then: determine s2x (rank) = ∑(x-x-)2/(n-1) and
s2y (rank) = ∑(y-y-) / (n-1)
Rs = covariance / √(s2x) * √(s2y)
Kendall’s tau (τ)
Consider pairs of points: pair of points is called
concordant; 1 point in pair has both a higher x and
a higher y
In example number of concordant pairs, k+ = 7
And number of discordant pairs k- = 1 (x-value is larger than point, and y not, or the
other way around)
K+ = upward arrow and k- = downward arrow
Neutral pairs (same x-value or same y-value) = 2
Tau-a = proportion of concordant – discordant pairs / number of pairs
7- = 0,6
Tau-b is used in SPSS (neutral pairs is partly included) and tau-c can also be calculated
Association is less → could be that scores are more spread around the line
SPSS:
Analyze → correlate → bivariate (2 variables)
Tick: pearson, Kendall’s tau-b, Spearman
Select the 2 variables
Test of significance → OK
In output of SPSS with correlation between A&C
Pearson correlation = r = 0,875 and p = 0,026
Spearman’s rho = rs = 0,763 and p = 0,067
Kendall’s tau-b = τ = 0,667 and p = 0,059
R is largest, but with rs and τ p is larger so…
• R is most extreme due to outlier and significant
• Values rs and τ smaller and not significant
• P for rs and τ almost similar
How do we obtain p?
3 correlation tests (statistically significance)
Testing H0: p(rho) = 0 = Pearson rho
T = r / (1-r2) * √(n-2)
Testing H0: ps = 0 Spearman rho
T = rs / (1-rs2) * √(n-2)
Testing H0: τ = 0 Kendall’s tau
Z = |K+ - K-| - 1 / (√(n(n-1)(2n+5)/18)
Partial correlation
Example 3: rjump, height = 0,454. Do we need to include a third variable such as BMI? =
Partial correlation = rxy.w = how big is rjump, height if you eliminate the influence of BMI?
1. Regression jumph (jumping height) on BMI: influence of BMI is removed from e’s
(error jump)
Exam 2
LECTURE 9
-Association interval & ordinal variables
Association measures
The smallest rho we can observe is -1 en the biggest +1 so -1 < r, rs, tau > +1
What is covariance?
Two graphs: grades they gave to movie and graph for their age. What
is the relation? If one goes up, the other goes down (grade for movie is
above average, the age is beneath
average, mirrored in that sense)
Score on Y, age on X → they covary
The graph says something about the
direction of association → negative (line
goes down)
Now: covariance + correlation with example 2
Three lectures
A; average = 7, standard deviation = 3
B; average = 6, standard deviation = 3
C; average = 6, standard deviation = 2
A comparing with B
A higher average, but sd is the same → vary identically, they covary fully; the grades
correlate maximum
Now A with C
Not the same average and not the same sd so covariance of C is smaller; they covary less
than A/B; grades correlate, but not maximum.
Covariance
With A/C, determine (x-, y-). In other words, average of A and average of C = 7 ; 6
X deviation = x – x-
Dx = -5, 0, 1, 1, 3
S2x = (∑dx)2 / (n-1) = variance of X
Covariance is similar but instead of dx * dx we’ll have ∑dxdy / (n-1)
So you also have to determine dy (y-y-) = -3, 1, -1, 1, 2
,So ∑dxdy = -5 x -3 + 0 x 1 + 1 x -1 + 1 x 1 + 3 x 2
= 21
Then the covariance is 21 / (n-1) = 21/4 = 5,25
So the covariance is kind of a ‘combined’
variance (can be positive or negative and gives
an indication for correlation → negative or
positive association but depends on the scale
you use = scale-sensitive
Therefore, covariance → correlation
R = covariance / sxsy (Standard deviation)
For example above: 5, x 2 = 0,875 (correlation coefficient, 0 = no correlation)
R2 = 0,77 (77% linearly explained)
R = not scale sensitive so you can compare different variables
R = coefficient of linear association (standardized covariance). -1 < r < 1
R = standardized regression coefficient b in case of simple regression (one independent
variable)
R2 = proportion variation in y linearly explained by x
Covariance is not an association measure (Scale sensitive) but we do use it to determine
correlation
Example; r = -0,5
• Negative correlation
• A 1.0 sx increase in x association with a 0,5sy decrease in y
• R2 = 0,25 (25% y-variation linearly explained by x = medium linear association)
Eta vs. r
Eta = more general
Eta2 = proportion variation y explained by x
Eta2 ≥ r2
(Because r2 is linearly explained (so less explained))
Advantage eta
• Variable x; every measurement level
• More general association
Disadvantage
• Less specific. With r, there is a direction
• Eta y on x is not the same as eta x on y (not symmetrical, as is the case with r)
Does the correlation make sense?
Sometimes it is high without making sense. Therefore, base it on existing theories!
Till now: pearson r
R vs. rank correlation, if
• 1 or both variable ordinal measurement level
• Increasing or decreasing, but curved
Advantage = more general useable
Disadvantage = less specific
Rank correlation measures; spearmans rs & Kendall’s tau
First: rank scores
, In our example, x-bar has 2 points on the third
score so 2x 3.5! And the last one 5. Do the same for
y-bar and you’ll have the rank scores!
First: determine covariance = 1,81 (∑dxdy / (n-1))
Then: determine s2x (rank) = ∑(x-x-)2/(n-1) and
s2y (rank) = ∑(y-y-) / (n-1)
Rs = covariance / √(s2x) * √(s2y)
Kendall’s tau (τ)
Consider pairs of points: pair of points is called
concordant; 1 point in pair has both a higher x and
a higher y
In example number of concordant pairs, k+ = 7
And number of discordant pairs k- = 1 (x-value is larger than point, and y not, or the
other way around)
K+ = upward arrow and k- = downward arrow
Neutral pairs (same x-value or same y-value) = 2
Tau-a = proportion of concordant – discordant pairs / number of pairs
7- = 0,6
Tau-b is used in SPSS (neutral pairs is partly included) and tau-c can also be calculated
Association is less → could be that scores are more spread around the line
SPSS:
Analyze → correlate → bivariate (2 variables)
Tick: pearson, Kendall’s tau-b, Spearman
Select the 2 variables
Test of significance → OK
In output of SPSS with correlation between A&C
Pearson correlation = r = 0,875 and p = 0,026
Spearman’s rho = rs = 0,763 and p = 0,067
Kendall’s tau-b = τ = 0,667 and p = 0,059
R is largest, but with rs and τ p is larger so…
• R is most extreme due to outlier and significant
• Values rs and τ smaller and not significant
• P for rs and τ almost similar
How do we obtain p?
3 correlation tests (statistically significance)
Testing H0: p(rho) = 0 = Pearson rho
T = r / (1-r2) * √(n-2)
Testing H0: ps = 0 Spearman rho
T = rs / (1-rs2) * √(n-2)
Testing H0: τ = 0 Kendall’s tau
Z = |K+ - K-| - 1 / (√(n(n-1)(2n+5)/18)
Partial correlation
Example 3: rjump, height = 0,454. Do we need to include a third variable such as BMI? =
Partial correlation = rxy.w = how big is rjump, height if you eliminate the influence of BMI?
1. Regression jumph (jumping height) on BMI: influence of BMI is removed from e’s
(error jump)