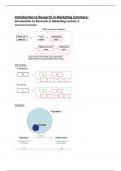
Introduction to Research in Marketing Summary:
Introduction to Research in Marketing Lecture 1:
Total error framework:
A/B Testing:
Sampling:
,Sampling error:
Coverage error= not everyone is covered in the sample, because not everyone has a
telephone
Sample error= biased sampling, not random
Non-response error= not everyone will reply
Problem:
- Smartphone adoption means everyone screens their calls
- The sample of respondents differs significantly form the population
- Non-response error
In practice:
- Basically, in lots of data sets and every survey:
o Sampling
o Adjust using post-stratification weights
- Make your sample closer to your population by using post-stratification weights
- Example: polls for upcoming elections:
o The survey results were weighted by gender, age, region, level of education,
and voting behaviour in the parliamentary elections in March 2021.
Why is it important:
- Clinton vs Trump election in 2016: why were the polls wrong?
o People with higher education levels are more likely to participate in polls.
- Fixed in 2020:
,Measurement scales: (measurement error)
Non-metric:
- Nominal= number serves only as label or tag for identifying or classifying objects in
mutually exclusive and collectively exhaustive categories.
o Mutually exclusive: not at the same time
o Collectively exclusive: at least one
- Ordinal= numbers are assigned to objects to indicate the relative positions of some
characteristics of objects, but not the magnitude of difference between them.
These outcomes can be categorical or directional can measure only the direction of the
response (e.g., yes or no)
Metric:
- Interval= numbers are assigned to objects to indicate the relative positions of some
characteristics of objects with differences between objects being comparable, zero
point arbitrary.
- Ratio= the most precise scale, absolute zero point, has all the advantages of other
scales.
In contrast, when scales are continuous, they noy only measure direction or classification,
but intensity as well (e.g., strongly agree or somewhat agree)
Why is it important to know:
- Get the units right: the right statistical technique depends on what scale is used, e.g.,
metric vs non-metric
o It makes no sense to calculate the mean of a nominal or ordinal scaled
variable
- Statistical software packages (like R) expects variables to be of a particular type
(results may depend on it)
Summated Scales:
- Measuring some variables is easier than others
- Often interested in measuring attitudes, feelings, or beliefs that are more abstract
than, say, age or income
- More than 1 question needed to capture all facets (reducing measurement error)
- Example: Frugality
, - Eight, seven-point Likert-type statements (1= completely disagree – 7= completely
agree):
1. I believe in being careful in how I spend my money
2. I discipline myself to get the most from my money
3. Etc…
Measurement error:
Validity= does it measure what it’s supposed to do?
Reliability= is it stable?
In practice:
- Validity: do these coefficients make sense? (do the effects sizes and signs give
plausible model results?)
o 10% increase in price leads to 200% increase in sales???
- Reliability: how much do these results change if:
o We add additional control variables to the model
o We take away some observations (e.g., outliners)
o We estimate the same model on a new data set
Statistical error:
Two possible outcomes of hypothesis testing:
- Fails to reject the null (null is true)
- Reject the null (alternative is true)
Two types of errors when hypothesis testing:
- Type 1= say something is happening while nothing is happening → Reject null
hypothesis
- Type 2= don’t say something is happening while something is happening → do not
reject null hypothesis