Week 1
Knowledge clips & book
Introduction
Attack rate = a measure of risk (% of population that gets the disease) or incidence proportion often
used for an outbreak that occurs over a relatively short time period.
Relative risk = risk ratio = comparison of the amount of disease in one group relative to that in
another group = e.g. percentage of disease in group 1 / percentage of disease in group 2
Environmental factors = all non-genetic factors, including psychological, behaviour, social and
cultural traits, and obvious environmental exposures such as air pollution.
Descriptive statistics are important to get knowledge about the nature and size of a health problem.
If a problem has been identified, it should be known what the cause is and how the exposure to the
cause can be reduced to prevent the disease (‘primary’ prevention programme).
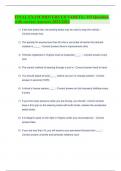
Production, food chain, social & built environment (1) have impact nutrition, nutrients, habits and
intake (2) which in turn have an impact on health and disease in population (3).
Epidemiology in the academic setting is about the causal factors (2→3). An epidemiologist in
academic settings generates knowledge. It is about who, when, where, why and what. Patterns and
causes are analysed to be sure about a specific exposure-effect, independent of the context of this
person or population. In the academic setting the validity and precision are important to determine
causation. It assumes ‘Et cetris paribus’: “all other things equal”, it focusses only on the effect of one
thing.
Epidemiology in public health setting is about prevention and health promotion (1→2). An
epidemiologist in Public Health setting applies knowledge to get the best prevention strategy for a
specific population/risk factors. Information from the academic setting is used for prevention in
population via policies, programmes and intervention. From an academic setting to a public health
setting, other factors, context, values etc. are incorporated. To use knowledge, it should be
generalizable and important for the specific population. The best practice is used. It should be
relevant to the specific population, place and time.
DISH Model: Determinants of diet and lifestyle shapes the Intake of food and nutrients which in turn
which influence the Status and function of the body. This impacts Health and disease risk.
History of epidemiology and public health
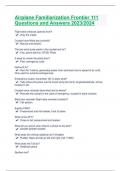
The top 10 diseases over time changed from infectious diseases to chronic diseases.
The shift in research went from infectious diseases to chronic diseases to any disease to all aspects of
human health. History of epidemiology and Public Health:
- Pre-formal (1662-1900)
o There was started by counting of people that were infected and died. The fucus was
on hygiene and sanitation. People travelled all over the world and diseases were
imported and exported such as pueperal fever and cholera. Group thinking started to
emerge, and it was applied to infectious diseases
o Infectious diseases, nutritional deficiencies
o Key figures: Grount, Farr and Snow
▪ In 1854 John Snow investigated cholera and stopped the epidemic by
removing the handle of infected water pumps.
- Early (1900-1940)
o The first professor in epidemiology was appointed. Social medicine and statistics
were combined in epidemiology. They focussed on non-communicable diseases,
pellagra and vitamins. The interdiciplinary nature of epidemiology came more on the
foreground.
o Transition of acute infectious to chronic diseases
1
, - Classical (1940-1980)
o Large-scale epidemiological studies were started. New epi-methods and study
designes were developed such as case-control, cohort, ecological, RCT, stratification
and regression.
o The focuss was on chronic diseases
o An important example are smoking and lung cancer studies
- Modern (1980 onwards)
o Theoretical bases in RCT and intervention trials, differentiation of expertise (also
public health and academic field)
o Prevention strategies were developed (primary, secondary and tertiary)
Some triumphs in epidemiology:
- Identification of water as a major reservoir and vehicle of communicable diseases such as
cholera and typhoid fever (1849-1856)
- Identification of arthropod vectors (e.g., mosquitos, flies) for many diseases: malaria, yellow
fever, sleeping sickness (1895-1909)
- Cigarette smoking found to be major cause of lung cancer, emphysema, and cardiovascular
diseases (1951-1963)
- Identification of the AIDS syndrome and that it is caused by a sexually-transmitted virus
(1981-1983). N.B. Development of prevention measures was before the virus was identified
Descriptive and analytical epidemiology
Descriptive epidemiology studies the amount/frequency of disease or other conditions in a
population (person/who?, time, place).
Analytical epidemiology studies the causes of disease (exposure-disease associations).
With descriptive studies you describe groups of people, e.g. demographics, behaviour and risk
factors. It is important to take a representative sample. Descriptive data is needed:
- To evaluate the occurrence of health behaviours and health conditions (disease). Time trends
and specific population subgroups are investigated
- To provide a basis for planning and evaluation of interventions
- Can be used for further analytical studies
Measures of disease occurrence
Prevalence proportion measures the proportion of people in a population who have the disease at a
given point in time. Prevalence is measured in a cross-sectional study in which people are asked if
they have the disease. With prevalence you can make a distinction between:
- Point prevalence: 1 time point, e.g. at one day
- Period prevalence: longer period of time, e.g. a week/month/year
Prevalence proportion= (number of people with disease at a given point in time)/ (total number of
people in the population).
Incidence measures how fast people get the disease. It considers the new cases.
Incidence proportion (IP) = Cumulative incidence (CI) measures the proportion of people who
develop the disease during a specified period = (number of people who develop disease in a specified
period)/ (number of people at risk of getting the disease at the start of the period).
For IP, only the people of risk are considered, e.g. only men for prostate diseases. IP can only be used
with complete follow-up and no competing mortality. Only then, it is the estimate of the average risk
of the persons in the cohort.
Incidence is measured with a cohort study, in which a group is followed to see who develops the
disease.
2
,Incidence rate (IR)= Incidence density (~mortality rate) = (number of people who develop of
disease)/(number of persons-years when people were at risk of getting the disease).
IR considers the time at risk (sum of the years that participants participated in the study) instead of
people are at risk is used.
A closed population is based on fixed membership, no one can be added but people may die or be
lost due to follow-up. The whole population is followed, but becomes smaller in time. An example is
a birth cohort. Incidence proportion and incidence rate can be measured.
An open cohort or dynamic population can take new members with time. There is no follow-up when
leaving. The numbers remain about the same. An example is Wageningen University. Incidence rate
can be measured, incidence proportion not.
Prevalence varies directly with both incidence and duration:
- If incidence is low, but duration is long (chronic) the prevalence will be large in relation to
incidence.
- If prevalence is low because of short duration (due to recovery, migration or death), the
prevalence will be small in relation to incidence.
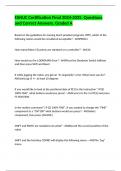
The relationship between incidence and prevalence can be illustrated with a bathtub. The bathtub
represents the community and the amount of water in it is the prevalence. The higher the water, the
higher the prevalence, the more people have the disease. The duration makes the prevalence higher
or lower. The prevalence can be decreased by the drain of the bathtub. The prevalence can be
decreased by people that die or are cured. When the deaths are prevented, this can increase the
prevalence (more are alive that have the disease). The prevalence can also be increased by incidence.
The incidence adds to the water in the tub.
For a stationary population (number of people entering = the number of people leaving) with a low
prevalence of disease (<10%): Prevalence = incidence * duration
Incidence is generally used for acute diseases. Incidence is more important with etiology.
Prevalence is used for more permanent stages, conditions or attributes of ill-health. Prevalence is
used with the societal burden of the disorder including the costs and resources consumed as a result
of the disorder.
Diabetes
Type 1 diabetes is an auto-immune disease. There is no production of insulin. It usually develops in
childhood and patients require lifelong insulin injections.
Type 2 diabetes is the major form and is a metabolic disorder characterized by hyperglycemia and
altered lipid metabolism. It usually develops in adulthood and is associated with a unhealthy lifestyle.
Gestational diabetes occurs during pregnancy. It is a state of hyper glycemia developed during
pregnancy. The mothers often develop type 2 diabetes later in live.
3
, Diabetes complications:
- Macrovascular: stroke (can lead to vascular dementia in elderly), heart disease and
hypertension, peripheral vascular disease, foot problems
- Microvascular: diabetic eye disease (may lead to blindness), renal disease, neuropathy and
foot problems
Intermediate states (prediabetes):
- Impaired Fasting Hyperglycemia (IFG): fasting plasma glucose level 5.6 -7.0 mM
- Impaired Glucose Tolerance (IGT): fasting glucose <7.0 mM and 2 hour post 75g glucose 7.8 -
11.1 mM
In the past diabetes was observed with sweet urine. Nowadays the oral glucose tolerance test is used
(glycaemic response to 75g glucose). There can also be looked at Hba1c (glycosylated hemoglobin),
which reflects the glycaemic control over the past 6 weeks, but the measurement is quite expensive.
The different screening methods leads to different prevalence outcomes.
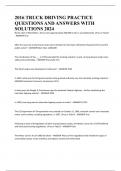
Type 2 diabetes starts with genetic susceptibility, but also other factors have an effect (especially
obesity) which leads to insulin resistance. The cells don’t take up enough glucose. This leads to an IGT
response, and more and more insulin is produced in response. The beta cells can’t handle it anymore
and type 2 diabetes is developed.
The primary goal of treatment is to bring blood glucose levels back to a normal range. The treatment
starts with lifestyle interventions (weight loss, dietary modifications and physical activity and
exercise). When this fails, drug therapy is used. Drugs are targeted at the enzymes involved in
glucose regulation. If this works not as well, insulin injections are used.
4
Knowledge clips & book
Introduction
Attack rate = a measure of risk (% of population that gets the disease) or incidence proportion often
used for an outbreak that occurs over a relatively short time period.
Relative risk = risk ratio = comparison of the amount of disease in one group relative to that in
another group = e.g. percentage of disease in group 1 / percentage of disease in group 2
Environmental factors = all non-genetic factors, including psychological, behaviour, social and
cultural traits, and obvious environmental exposures such as air pollution.
Descriptive statistics are important to get knowledge about the nature and size of a health problem.
If a problem has been identified, it should be known what the cause is and how the exposure to the
cause can be reduced to prevent the disease (‘primary’ prevention programme).
Production, food chain, social & built environment (1) have impact nutrition, nutrients, habits and
intake (2) which in turn have an impact on health and disease in population (3).
Epidemiology in the academic setting is about the causal factors (2→3). An epidemiologist in
academic settings generates knowledge. It is about who, when, where, why and what. Patterns and
causes are analysed to be sure about a specific exposure-effect, independent of the context of this
person or population. In the academic setting the validity and precision are important to determine
causation. It assumes ‘Et cetris paribus’: “all other things equal”, it focusses only on the effect of one
thing.
Epidemiology in public health setting is about prevention and health promotion (1→2). An
epidemiologist in Public Health setting applies knowledge to get the best prevention strategy for a
specific population/risk factors. Information from the academic setting is used for prevention in
population via policies, programmes and intervention. From an academic setting to a public health
setting, other factors, context, values etc. are incorporated. To use knowledge, it should be
generalizable and important for the specific population. The best practice is used. It should be
relevant to the specific population, place and time.
DISH Model: Determinants of diet and lifestyle shapes the Intake of food and nutrients which in turn
which influence the Status and function of the body. This impacts Health and disease risk.
History of epidemiology and public health
The top 10 diseases over time changed from infectious diseases to chronic diseases.
The shift in research went from infectious diseases to chronic diseases to any disease to all aspects of
human health. History of epidemiology and Public Health:
- Pre-formal (1662-1900)
o There was started by counting of people that were infected and died. The fucus was
on hygiene and sanitation. People travelled all over the world and diseases were
imported and exported such as pueperal fever and cholera. Group thinking started to
emerge, and it was applied to infectious diseases
o Infectious diseases, nutritional deficiencies
o Key figures: Grount, Farr and Snow
▪ In 1854 John Snow investigated cholera and stopped the epidemic by
removing the handle of infected water pumps.
- Early (1900-1940)
o The first professor in epidemiology was appointed. Social medicine and statistics
were combined in epidemiology. They focussed on non-communicable diseases,
pellagra and vitamins. The interdiciplinary nature of epidemiology came more on the
foreground.
o Transition of acute infectious to chronic diseases
1
, - Classical (1940-1980)
o Large-scale epidemiological studies were started. New epi-methods and study
designes were developed such as case-control, cohort, ecological, RCT, stratification
and regression.
o The focuss was on chronic diseases
o An important example are smoking and lung cancer studies
- Modern (1980 onwards)
o Theoretical bases in RCT and intervention trials, differentiation of expertise (also
public health and academic field)
o Prevention strategies were developed (primary, secondary and tertiary)
Some triumphs in epidemiology:
- Identification of water as a major reservoir and vehicle of communicable diseases such as
cholera and typhoid fever (1849-1856)
- Identification of arthropod vectors (e.g., mosquitos, flies) for many diseases: malaria, yellow
fever, sleeping sickness (1895-1909)
- Cigarette smoking found to be major cause of lung cancer, emphysema, and cardiovascular
diseases (1951-1963)
- Identification of the AIDS syndrome and that it is caused by a sexually-transmitted virus
(1981-1983). N.B. Development of prevention measures was before the virus was identified
Descriptive and analytical epidemiology
Descriptive epidemiology studies the amount/frequency of disease or other conditions in a
population (person/who?, time, place).
Analytical epidemiology studies the causes of disease (exposure-disease associations).
With descriptive studies you describe groups of people, e.g. demographics, behaviour and risk
factors. It is important to take a representative sample. Descriptive data is needed:
- To evaluate the occurrence of health behaviours and health conditions (disease). Time trends
and specific population subgroups are investigated
- To provide a basis for planning and evaluation of interventions
- Can be used for further analytical studies
Measures of disease occurrence
Prevalence proportion measures the proportion of people in a population who have the disease at a
given point in time. Prevalence is measured in a cross-sectional study in which people are asked if
they have the disease. With prevalence you can make a distinction between:
- Point prevalence: 1 time point, e.g. at one day
- Period prevalence: longer period of time, e.g. a week/month/year
Prevalence proportion= (number of people with disease at a given point in time)/ (total number of
people in the population).
Incidence measures how fast people get the disease. It considers the new cases.
Incidence proportion (IP) = Cumulative incidence (CI) measures the proportion of people who
develop the disease during a specified period = (number of people who develop disease in a specified
period)/ (number of people at risk of getting the disease at the start of the period).
For IP, only the people of risk are considered, e.g. only men for prostate diseases. IP can only be used
with complete follow-up and no competing mortality. Only then, it is the estimate of the average risk
of the persons in the cohort.
Incidence is measured with a cohort study, in which a group is followed to see who develops the
disease.
2
,Incidence rate (IR)= Incidence density (~mortality rate) = (number of people who develop of
disease)/(number of persons-years when people were at risk of getting the disease).
IR considers the time at risk (sum of the years that participants participated in the study) instead of
people are at risk is used.
A closed population is based on fixed membership, no one can be added but people may die or be
lost due to follow-up. The whole population is followed, but becomes smaller in time. An example is
a birth cohort. Incidence proportion and incidence rate can be measured.
An open cohort or dynamic population can take new members with time. There is no follow-up when
leaving. The numbers remain about the same. An example is Wageningen University. Incidence rate
can be measured, incidence proportion not.
Prevalence varies directly with both incidence and duration:
- If incidence is low, but duration is long (chronic) the prevalence will be large in relation to
incidence.
- If prevalence is low because of short duration (due to recovery, migration or death), the
prevalence will be small in relation to incidence.
The relationship between incidence and prevalence can be illustrated with a bathtub. The bathtub
represents the community and the amount of water in it is the prevalence. The higher the water, the
higher the prevalence, the more people have the disease. The duration makes the prevalence higher
or lower. The prevalence can be decreased by the drain of the bathtub. The prevalence can be
decreased by people that die or are cured. When the deaths are prevented, this can increase the
prevalence (more are alive that have the disease). The prevalence can also be increased by incidence.
The incidence adds to the water in the tub.
For a stationary population (number of people entering = the number of people leaving) with a low
prevalence of disease (<10%): Prevalence = incidence * duration
Incidence is generally used for acute diseases. Incidence is more important with etiology.
Prevalence is used for more permanent stages, conditions or attributes of ill-health. Prevalence is
used with the societal burden of the disorder including the costs and resources consumed as a result
of the disorder.
Diabetes
Type 1 diabetes is an auto-immune disease. There is no production of insulin. It usually develops in
childhood and patients require lifelong insulin injections.
Type 2 diabetes is the major form and is a metabolic disorder characterized by hyperglycemia and
altered lipid metabolism. It usually develops in adulthood and is associated with a unhealthy lifestyle.
Gestational diabetes occurs during pregnancy. It is a state of hyper glycemia developed during
pregnancy. The mothers often develop type 2 diabetes later in live.
3
, Diabetes complications:
- Macrovascular: stroke (can lead to vascular dementia in elderly), heart disease and
hypertension, peripheral vascular disease, foot problems
- Microvascular: diabetic eye disease (may lead to blindness), renal disease, neuropathy and
foot problems
Intermediate states (prediabetes):
- Impaired Fasting Hyperglycemia (IFG): fasting plasma glucose level 5.6 -7.0 mM
- Impaired Glucose Tolerance (IGT): fasting glucose <7.0 mM and 2 hour post 75g glucose 7.8 -
11.1 mM
In the past diabetes was observed with sweet urine. Nowadays the oral glucose tolerance test is used
(glycaemic response to 75g glucose). There can also be looked at Hba1c (glycosylated hemoglobin),
which reflects the glycaemic control over the past 6 weeks, but the measurement is quite expensive.
The different screening methods leads to different prevalence outcomes.
Type 2 diabetes starts with genetic susceptibility, but also other factors have an effect (especially
obesity) which leads to insulin resistance. The cells don’t take up enough glucose. This leads to an IGT
response, and more and more insulin is produced in response. The beta cells can’t handle it anymore
and type 2 diabetes is developed.
The primary goal of treatment is to bring blood glucose levels back to a normal range. The treatment
starts with lifestyle interventions (weight loss, dietary modifications and physical activity and
exercise). When this fails, drug therapy is used. Drugs are targeted at the enzymes involved in
glucose regulation. If this works not as well, insulin injections are used.
4