
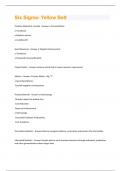
Six Sigma- Yellow Belt Questions and Answers
Problem Statement- Include - Answer-o Process/Defect o Timeframe o Baseline metrics o Cost/Benefit Goal Statement - Answer-o Targeted Improvement o Timeframe o Projected Financial Benefits Project Defect - Answer-Instance which fails to meet customer requirement Metrics - Answer--Primary Metric - Big "Y" o Secondary Metrics Possible negative consequences Financial Benefit - Answer-o Hard Savings Directly Impact the bottom line Cost Reduction Revenue Enhancement o Soft Savings Increased Employee Productivity Cost Avoidance Descriptive Statistics - Answer-Data to recognize patterns, summarize and present the information Inferential Statistics - Answer-Sample data to aid in business decisions through estimates, predictions and other generalizations about larger dataShift and Drift - Answer-Over time a process will shift and drift up to 1.5 sigma levels due to changes in technology and personnel. What is Six Sigma - Answer-Business Philosophy -Project focused methodology resulting in significant financial gains -Team approach -State of near perfection 3.4 defects PMO Define Customer - Answer-Anyone who buys or whose success or satisfaction depends on one's actions To increase process sigma, decrease the variation or variability - Answer-T or F True What are the basic principles of data collection - Answer-Observe first, then measure Know the data type Measure for a reason Have a measurement process Develop a sampling scheme What are the types of data and describe the characteristics associated with each - Answer-Continuous or Variable Infinitely Divisible Continuum Half Test Discrete or Attribute Has Clear Boundaries Can be sortedWhat are the areas of statistics and describe the characteristics associated with each - AnswerDescriptive - Used to recognize patterns Inferential - Uses sample data to aid with business decisions through estimates. What is the difference between population and sample - Answer-Population is every possible observation or census. Sample is a subset of the population. What is a Pareto chart and why is it used - Answer-Measure phase to determine the 80/20 rule Which inputs have the greatest effect Determine the X's for the project focus Prioritizing design elements for DFSS What are the descriptive statistical measures of central tendency and describe each - Answer-Mean - Average Median - 50/50 split Mode - Value that occurs the most often What are the descriptive statistical measures of dispersion and describe each - Answer-Range - Distance between the extreme values Deviation - Distance between sample value and the average Variance - Measure of the variation around the mean in squared units Standard Deviation - Measure of the variation around the mean What is the difference between Sigma and Process Sigma - Answer-Process Sigma measure the capability of the process to perform defect free work and detect how well the process is performing. Sigma is Process Standard Deviation. D in DMAIC= - Answer-• Define o Project Definitiono Five Sources of Opportunity Strategic Objectives • CTB Trees VOC - Voice of Customer • Kano Model o Must Be o More is Better o Delighters Benchmarking • Industry Standard • Best Practices COPQ • Any cost that would not have been incurred if quality were perfect Hidden Factory • Rolled Throughput Yield M in DMAIC - Answer-• Measure - data collection, measuring current process o SIPOC / SIPOC Plus Graphical representation of current process o Project Drill Down Tree o Data Collection Normal versus non-normal Discrete-attribute / Continuious-variable o Basic Statistics - Graphical Summary Anderson Darling normality test o Pareto 80/20 o Process Capability Z BenchNormal versus non-normal o Sigma Conversion Tool o FMEA o Minitab
Documentinformatie
- Geüpload op
- 5 mei 2024
- Aantal pagina's
- 6
- Geschreven in
- 2023/2024
- Type
- Tentamen (uitwerkingen)
- Bevat
- Vragen en antwoorden



