1. Introduction
Scarcity is the mother of economics.
Microeconomics is the study of how individuals and firms make themselves as well off as possible in
a world of scarcity, and the consequences of those individual decisions for markets and the entire
economy.
In this chapter, we discuss three main topics:
1. Microeconomics: The Allocation of Scare Resources: microeconomics is the study of the
allocation of scare resources.
2. Models: economists use models to make testable predictions.
3. Use of Microeconomic models: individuals, governments, and firms use microeconomic
models and predictions making.
1.1 Microeconomics: The Allocation of Scare Resources
Trade-Offs
People make trade-offs because they can’t have everything. A society faces three key trade-offs:
1. Which goods and services to produce: if a society produces more of good a, it must produce
fewer of other goods and services, because it has only a limited amount of resources
available to produce the goods.
2. How to produce: to produce a given level of output, a firm must use more of one input if it
uses less of another input.
3. Who gets the goods and services: the more of society’s goods and services you get, the less
someone else gets.
Who Makes the Decisions?
The government may make these three allocation decisions explicitly, or the final decisions may
reflect the interaction of independent decisions by many individual consumers and firms.
How Prices Determine Allocations
Prices link the decisions about:
• Which goods and services to produce;
• How to produce them;
• And who gets them.
Prices influence the decisions of individual consumers and firms, and the interactions of these
decisions by consumers, firms, and the government determine price.
Interactions between consumers and firms take place in a market, which is an exchange mechanism
that allows buyers to trade with sellers.
1
,1.2 Models
To explain how individuals and firms allocate resources and how market prices are determined,
economists use a model: a description of the relationship between two or more variables. Economist
also use models to predict how a change in one variable will affect another variable.
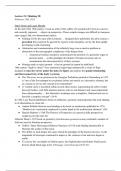
Income Threshold
According to an income threshold model, no one who has an income level below
a threshold buys a particular consumer durable, which is a good that can be
used for long periods, such as a refrigerator or car. The theory also holds that
almost everyone whose income is above that threshold buys the durable.
Simplifications by Assumptions
An economic model is a simplification of reality that contains only reality’s most important features.
--> Economists make assumptions to simplify their models.
Testing Theories
Economic theory is the development and use of a model to formulate hypotheses which are
predictions about case and effect.
Economist test theories by checking whether predictions are correct: if a prediction does not come
true, economists may reject the theory.
Maximizing Subject to Constraints
A key assumption in most microeconomic models is that individuals allocate their scare resources so
as to make themselves as well off as possible.
Positive Versus Normative
Those are my principles. If you don’t like them, I have others. – Groucho Marx
A positive statement: a testable hypothesis about matters of fact such as cause and effect relations.
Positive does not mean that we are certain about the truth of our statement; it indicates only that
we can test whether it is true.
A normative statement: a conclusion as to whether something is good or bad. A normative
statement cannot be tested because a value judgment cannot be refuted by evidence. It is a
prescription rather than a prediction.
A normative statement concerns what somebody believes should happen; a positive statement
concerns what will happen.
1.3 Uses of Microeconomic Models
Because microeconomic models explain why economic decisions are made and allow us to make
predictions, they can be very useful for individuals, governments, and firms in making decisions.
2
,2. Supply and Demand
The supply-and-demand model describes how consumers and supplier interact to determine the
price and the quantity of a good or service.
In this chapter, we examine eight main topics:
1. Demand: the quantity of a good or service that consumers demand depends on price and
other factors such as consumers’ income and the prices of related goods.
2. Supply: the quantity of a good or service that firms supply depends on price and other
factors such as the cost of inputs that firms use to produce the good or service.
3. Market Equilibrium: the interaction between the consumers’ demand curve and the firms’
supply curve determines the market price and quantity of a good or service that is bought
and sold.
4. Shocking the Equilibrium: Comparative Statics: changes in a factor that affect demand (such
as consumers’ income), supply (such as a rise in the price of inputs), or a new government
policy (such as a new tax) alter the market or equilibrium price and quantity of a good.
5. Elasticities: given estimates of summary statistics called elasticities, economists can forecast
the effects of changes in taxes and other factors on market price and quantity.
6. Effect of a Sales Tax: how a sales tax increase affects the price and quantity of a good and
whether the tax falls more heavily on consumers or on suppliers, depend on the supply and
demand curves.
7. Quantity Supplied Need Not Equal Quantity Demanded: if the government regulates the
prices in a market, the quantity supplied might not equal the quantity demanded.
8. When to Use the Supply-and-Demand Model: the supply-and-demand model applies to
competitive markets only.
2.1 Demand
The quantity demanded is the amount of a good that consumers are willing to buy at a given price
during a specific period, holding constant the other factors that influence purchases.
Potential consumers decide how much of a good or service to buy based on its price, which is
expressed as an amount of money per unit of the good, and many other factors:
• Consumers’ tastes --> people don’t buy products they dislike
• Information
• Income --> more wealth leads to more luxury items people buy
• Prices of other goods --> substitutes (a product similar or identical) or complements (goods
you like to consume at the same time)
• Government actions -->sales taxes increase the price that a consumer must spend on a good,
and government-imposed limits on the use of a good can affect demand
• Other factors
The Demand Function
The demand function shows the correspondence between the quantity demanded, price, and other
factors that influence purchases.
3
, A substitute is a good or service that may be consumed instead of another good or service.
--> For example: tea is a substitute for coffee
A complement is a good or service that is jointly consumed with another good or service.
--> For example: many people drink coffee with sugar
Let’s examine the demand function for coffee:
(2.1) 𝑄 = 𝐷(𝑝, 𝑝𝑠 , 𝑌)
Q = the quantity of coffee demanded; p = the price of coffee; ps = the price of sugar and Y =
consumers’ income.
(2.2) 𝑄 = 8.56 − 𝑝 − 0.3𝑝𝑠 + 0.1𝑌
For example: price of sugar is $0.20 per lb and average income is $35 thousand per year
𝑄 = 8.56 − 𝑝 − (0.3 × 0.2) + (0.1 × 35)
(2.3) 𝑄 = 12 − 𝑝
A demand curve is a plot of the demand function that shows the quantity demanded at each possible
price, holding constant the other factors that influence purchases.
--> The horizontal axis measures Q; the vertical axis measures p
A Change in a Product’s Price Causes a Movement Along the Demand Curve
Changes in the quantity demanded in response to changes in price are movements along the demand
curve.
The Law of Demand: consumers demand more of a good the lower its price, holding constant tastes,
the prices of other goods, and other factors that influence the amount they consume.
--> A higher price results in a lower quantity demanded: downward sloping curve.
If the demand function is 𝑄 = 𝐷(𝑝), then the Law of Demand says that dQ/dp < 0, where dQ/dp is
the derivative of the D function with respect to p.
--> The derivative of the quantity of coffee demanded with respect to its price in Equation 2.3 is
𝑑𝑄
= −1
𝑑𝑝
--> A small change in the price causes an equal unit decrease in the quantity demanded.
𝑟𝑖𝑠𝑒 ∆𝑝
𝑠𝑙𝑜𝑝𝑒 = =
𝑟𝑢𝑛 ∆𝑄
A Change in Another Factor Causes the Demand Curve to Shift
A change in any factor other than the price of the good itself causes a shift of the demand curve
rather than a movement along the demand curve.
4
Scarcity is the mother of economics.
Microeconomics is the study of how individuals and firms make themselves as well off as possible in
a world of scarcity, and the consequences of those individual decisions for markets and the entire
economy.
In this chapter, we discuss three main topics:
1. Microeconomics: The Allocation of Scare Resources: microeconomics is the study of the
allocation of scare resources.
2. Models: economists use models to make testable predictions.
3. Use of Microeconomic models: individuals, governments, and firms use microeconomic
models and predictions making.
1.1 Microeconomics: The Allocation of Scare Resources
Trade-Offs
People make trade-offs because they can’t have everything. A society faces three key trade-offs:
1. Which goods and services to produce: if a society produces more of good a, it must produce
fewer of other goods and services, because it has only a limited amount of resources
available to produce the goods.
2. How to produce: to produce a given level of output, a firm must use more of one input if it
uses less of another input.
3. Who gets the goods and services: the more of society’s goods and services you get, the less
someone else gets.
Who Makes the Decisions?
The government may make these three allocation decisions explicitly, or the final decisions may
reflect the interaction of independent decisions by many individual consumers and firms.
How Prices Determine Allocations
Prices link the decisions about:
• Which goods and services to produce;
• How to produce them;
• And who gets them.
Prices influence the decisions of individual consumers and firms, and the interactions of these
decisions by consumers, firms, and the government determine price.
Interactions between consumers and firms take place in a market, which is an exchange mechanism
that allows buyers to trade with sellers.
1
,1.2 Models
To explain how individuals and firms allocate resources and how market prices are determined,
economists use a model: a description of the relationship between two or more variables. Economist
also use models to predict how a change in one variable will affect another variable.
Income Threshold
According to an income threshold model, no one who has an income level below
a threshold buys a particular consumer durable, which is a good that can be
used for long periods, such as a refrigerator or car. The theory also holds that
almost everyone whose income is above that threshold buys the durable.
Simplifications by Assumptions
An economic model is a simplification of reality that contains only reality’s most important features.
--> Economists make assumptions to simplify their models.
Testing Theories
Economic theory is the development and use of a model to formulate hypotheses which are
predictions about case and effect.
Economist test theories by checking whether predictions are correct: if a prediction does not come
true, economists may reject the theory.
Maximizing Subject to Constraints
A key assumption in most microeconomic models is that individuals allocate their scare resources so
as to make themselves as well off as possible.
Positive Versus Normative
Those are my principles. If you don’t like them, I have others. – Groucho Marx
A positive statement: a testable hypothesis about matters of fact such as cause and effect relations.
Positive does not mean that we are certain about the truth of our statement; it indicates only that
we can test whether it is true.
A normative statement: a conclusion as to whether something is good or bad. A normative
statement cannot be tested because a value judgment cannot be refuted by evidence. It is a
prescription rather than a prediction.
A normative statement concerns what somebody believes should happen; a positive statement
concerns what will happen.
1.3 Uses of Microeconomic Models
Because microeconomic models explain why economic decisions are made and allow us to make
predictions, they can be very useful for individuals, governments, and firms in making decisions.
2
,2. Supply and Demand
The supply-and-demand model describes how consumers and supplier interact to determine the
price and the quantity of a good or service.
In this chapter, we examine eight main topics:
1. Demand: the quantity of a good or service that consumers demand depends on price and
other factors such as consumers’ income and the prices of related goods.
2. Supply: the quantity of a good or service that firms supply depends on price and other
factors such as the cost of inputs that firms use to produce the good or service.
3. Market Equilibrium: the interaction between the consumers’ demand curve and the firms’
supply curve determines the market price and quantity of a good or service that is bought
and sold.
4. Shocking the Equilibrium: Comparative Statics: changes in a factor that affect demand (such
as consumers’ income), supply (such as a rise in the price of inputs), or a new government
policy (such as a new tax) alter the market or equilibrium price and quantity of a good.
5. Elasticities: given estimates of summary statistics called elasticities, economists can forecast
the effects of changes in taxes and other factors on market price and quantity.
6. Effect of a Sales Tax: how a sales tax increase affects the price and quantity of a good and
whether the tax falls more heavily on consumers or on suppliers, depend on the supply and
demand curves.
7. Quantity Supplied Need Not Equal Quantity Demanded: if the government regulates the
prices in a market, the quantity supplied might not equal the quantity demanded.
8. When to Use the Supply-and-Demand Model: the supply-and-demand model applies to
competitive markets only.
2.1 Demand
The quantity demanded is the amount of a good that consumers are willing to buy at a given price
during a specific period, holding constant the other factors that influence purchases.
Potential consumers decide how much of a good or service to buy based on its price, which is
expressed as an amount of money per unit of the good, and many other factors:
• Consumers’ tastes --> people don’t buy products they dislike
• Information
• Income --> more wealth leads to more luxury items people buy
• Prices of other goods --> substitutes (a product similar or identical) or complements (goods
you like to consume at the same time)
• Government actions -->sales taxes increase the price that a consumer must spend on a good,
and government-imposed limits on the use of a good can affect demand
• Other factors
The Demand Function
The demand function shows the correspondence between the quantity demanded, price, and other
factors that influence purchases.
3
, A substitute is a good or service that may be consumed instead of another good or service.
--> For example: tea is a substitute for coffee
A complement is a good or service that is jointly consumed with another good or service.
--> For example: many people drink coffee with sugar
Let’s examine the demand function for coffee:
(2.1) 𝑄 = 𝐷(𝑝, 𝑝𝑠 , 𝑌)
Q = the quantity of coffee demanded; p = the price of coffee; ps = the price of sugar and Y =
consumers’ income.
(2.2) 𝑄 = 8.56 − 𝑝 − 0.3𝑝𝑠 + 0.1𝑌
For example: price of sugar is $0.20 per lb and average income is $35 thousand per year
𝑄 = 8.56 − 𝑝 − (0.3 × 0.2) + (0.1 × 35)
(2.3) 𝑄 = 12 − 𝑝
A demand curve is a plot of the demand function that shows the quantity demanded at each possible
price, holding constant the other factors that influence purchases.
--> The horizontal axis measures Q; the vertical axis measures p
A Change in a Product’s Price Causes a Movement Along the Demand Curve
Changes in the quantity demanded in response to changes in price are movements along the demand
curve.
The Law of Demand: consumers demand more of a good the lower its price, holding constant tastes,
the prices of other goods, and other factors that influence the amount they consume.
--> A higher price results in a lower quantity demanded: downward sloping curve.
If the demand function is 𝑄 = 𝐷(𝑝), then the Law of Demand says that dQ/dp < 0, where dQ/dp is
the derivative of the D function with respect to p.
--> The derivative of the quantity of coffee demanded with respect to its price in Equation 2.3 is
𝑑𝑄
= −1
𝑑𝑝
--> A small change in the price causes an equal unit decrease in the quantity demanded.
𝑟𝑖𝑠𝑒 ∆𝑝
𝑠𝑙𝑜𝑝𝑒 = =
𝑟𝑢𝑛 ∆𝑄
A Change in Another Factor Causes the Demand Curve to Shift
A change in any factor other than the price of the good itself causes a shift of the demand curve
rather than a movement along the demand curve.
4