ARMS Lectures, Seminars, and
Workgroups
Lecture (13 nov):
Frequentist & Bayesian approach
Frequentist framework is still mainstream. It tests how well the data fit H0. It contains p-value,
confidence intervals, effect sizes, and power analysis. Empirical research uses collected data
to learn from, information in this data is captured in a likelihood function where we assume a
normal likelihood function. All relevant information for inference is contained in the
likelihood function. the Bayesian framework is increasingly popular. It tests the probability of
the hypothesis given the data, taking prior information into account. It contains Bayes factors,
priors, posteriors, and credible intervals.
Bayesian estimation
In addition to the data, we may also have prior information. The central idea/mechanism of
the Bayesian approach is that prior knowledge is updated with information in the data and
together provides the posterior distribution for µ(population). An advantage for the Bayesian
approach is that you’re accumulating knowledge. A disadvantage for the Bayesian approach is
that the results depend on choice of prior. The prior influences the posterior. You can use
different priors, and those lead to different posteriors. With a prior without any expectations,
the posterior will be the same as the data.
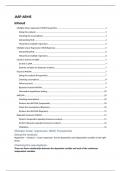
An example of Bayesian estimation of IQ:
We know that average IQ in the general population is 100 (range roughly 40-160). What prior
distributions can we specify?
These are different priors you can take. The different priors show different posteriors.
,Here are the differen posteriors shown with prior 1 and prior 3.
Bayesian probability
The sampling plan can influence the p-value. In an experiment where a lady had to guess if
they added tea to the milk or milk to the tea, this concept was shown. In this experiment the
Ho was that the lady was just guessing. Different sample plans showed different p-values. In
the first sample plan the lady guessed the first five times right and the last time wrong, this
resulted in 5 out of 6 correct guesses. The p-value of this sample plan was .109. The second
sample plan was that the lady had to guess until she got 5 correct. In this plan she got the
second one wrong, but the other 5 times were correct. The p-value of this sample plan
was .031.
Bayes conditions on observed data, whereas frequentist testing conditions on H0. Pr (Hj|data)
is the probability that hypothesis Hj is supported by the data. Pr(data|H0) is something
different, where the p-value is the probability of observing the same or more extreme data
given that the null is true. PMP is the posterior model probability and that is the Bayesioan
probability of the hypothesis after observing the data. Bayesian probability of a hypothesis
being true depends on how sensible it is, based on prior knowledge (the prior) and how well it
fits the new evidence (the data). Bayesian testing is comparative which means that hypotheses
are tested against one another, not in isolation. This is also seen in the Bayes factor.
Bf10=10 means the support for H1 is 10 times stronger than for H0.
Bf10=1 means the support for H1 is as strong as the support for H0.
Posterior probabilities of hypothesis are also relative probabilities. PMPs are updates of prior
probabilities (for hypotheses) with the BF.
Definition of probability
Both frameworks use the probability theory, but with frequentist the probability is the relative
frequency of events and with Bayesian probability is the degree of belief. This leads to debate
and to differences in the correct interpretation of statistical results. The frequentist 95%
confidence interval means that if we were to repeat this experiment many times and calculate
a CI each time, 95% of the intervals will include the true parameter value. The Bayesian 95%
credible interval means that there is 95% probability that the true value is in the credible
interval.
, Multiple Linear Regression (MLR)
A linear regression is a scatterplot for scores on the variables x and y and the linear positive
association between them. A multiple linear regression is the same, but multiple x variables.
The formula for this is showed below.
The observed outcome is the prediction based on the model (ŷ) plus prediction error.
Model assumptions
All results are only reliable if assumptions made by the model and approach roughly hold.
Serious violations lead to incorrect results. Sometimes there are easy solutions (deleting a
severe outlier), sometimes not. The MLR assumes interval/ratio variables (outcome and
predictors).
Dummy variables
If a variable in the MLR is categorical it can be turned into a dummy variable. A dummy
variable has 0 and 1 (for example 1 = male and 0 = female).
In this example the Dmale,i will be 1 if it’s a male and 0 if it’s a female.
Output analysis
Frequentist:
Estimate parameters of model
Test with NSHT if parameters are significantly non-zero
Output:
- R2: how much variance is explained by the model
- R: correlation between Y and Ŷ
- Adjusted R2: explained variance outside the experiment -> higher when the
sample is bigger
- p: does the model significantly explain R2
- Unstandardized: correlation between independent and dependent variable
Bayesian:
Estimate parameters of model
Workgroups
Lecture (13 nov):
Frequentist & Bayesian approach
Frequentist framework is still mainstream. It tests how well the data fit H0. It contains p-value,
confidence intervals, effect sizes, and power analysis. Empirical research uses collected data
to learn from, information in this data is captured in a likelihood function where we assume a
normal likelihood function. All relevant information for inference is contained in the
likelihood function. the Bayesian framework is increasingly popular. It tests the probability of
the hypothesis given the data, taking prior information into account. It contains Bayes factors,
priors, posteriors, and credible intervals.
Bayesian estimation
In addition to the data, we may also have prior information. The central idea/mechanism of
the Bayesian approach is that prior knowledge is updated with information in the data and
together provides the posterior distribution for µ(population). An advantage for the Bayesian
approach is that you’re accumulating knowledge. A disadvantage for the Bayesian approach is
that the results depend on choice of prior. The prior influences the posterior. You can use
different priors, and those lead to different posteriors. With a prior without any expectations,
the posterior will be the same as the data.
An example of Bayesian estimation of IQ:
We know that average IQ in the general population is 100 (range roughly 40-160). What prior
distributions can we specify?
These are different priors you can take. The different priors show different posteriors.
,Here are the differen posteriors shown with prior 1 and prior 3.
Bayesian probability
The sampling plan can influence the p-value. In an experiment where a lady had to guess if
they added tea to the milk or milk to the tea, this concept was shown. In this experiment the
Ho was that the lady was just guessing. Different sample plans showed different p-values. In
the first sample plan the lady guessed the first five times right and the last time wrong, this
resulted in 5 out of 6 correct guesses. The p-value of this sample plan was .109. The second
sample plan was that the lady had to guess until she got 5 correct. In this plan she got the
second one wrong, but the other 5 times were correct. The p-value of this sample plan
was .031.
Bayes conditions on observed data, whereas frequentist testing conditions on H0. Pr (Hj|data)
is the probability that hypothesis Hj is supported by the data. Pr(data|H0) is something
different, where the p-value is the probability of observing the same or more extreme data
given that the null is true. PMP is the posterior model probability and that is the Bayesioan
probability of the hypothesis after observing the data. Bayesian probability of a hypothesis
being true depends on how sensible it is, based on prior knowledge (the prior) and how well it
fits the new evidence (the data). Bayesian testing is comparative which means that hypotheses
are tested against one another, not in isolation. This is also seen in the Bayes factor.
Bf10=10 means the support for H1 is 10 times stronger than for H0.
Bf10=1 means the support for H1 is as strong as the support for H0.
Posterior probabilities of hypothesis are also relative probabilities. PMPs are updates of prior
probabilities (for hypotheses) with the BF.
Definition of probability
Both frameworks use the probability theory, but with frequentist the probability is the relative
frequency of events and with Bayesian probability is the degree of belief. This leads to debate
and to differences in the correct interpretation of statistical results. The frequentist 95%
confidence interval means that if we were to repeat this experiment many times and calculate
a CI each time, 95% of the intervals will include the true parameter value. The Bayesian 95%
credible interval means that there is 95% probability that the true value is in the credible
interval.
, Multiple Linear Regression (MLR)
A linear regression is a scatterplot for scores on the variables x and y and the linear positive
association between them. A multiple linear regression is the same, but multiple x variables.
The formula for this is showed below.
The observed outcome is the prediction based on the model (ŷ) plus prediction error.
Model assumptions
All results are only reliable if assumptions made by the model and approach roughly hold.
Serious violations lead to incorrect results. Sometimes there are easy solutions (deleting a
severe outlier), sometimes not. The MLR assumes interval/ratio variables (outcome and
predictors).
Dummy variables
If a variable in the MLR is categorical it can be turned into a dummy variable. A dummy
variable has 0 and 1 (for example 1 = male and 0 = female).
In this example the Dmale,i will be 1 if it’s a male and 0 if it’s a female.
Output analysis
Frequentist:
Estimate parameters of model
Test with NSHT if parameters are significantly non-zero
Output:
- R2: how much variance is explained by the model
- R: correlation between Y and Ŷ
- Adjusted R2: explained variance outside the experiment -> higher when the
sample is bigger
- p: does the model significantly explain R2
- Unstandardized: correlation between independent and dependent variable
Bayesian:
Estimate parameters of model