Economic Growth: A Model of Production W1
Facts and Questions about Growth
- GDP: main measure of aggregate economic activity. The market value of final goods and services
produced in an economy each year.
Measuring the Economic
- PPP-Adjusted Real GDP per capita
o When computing changes over time, we fix prices at a given baseline year (‘real’)
o When comparing different countries, we fix a set of international prices (‘PPP’). This is
useful since prices are generally higher in rich countries.
Growth Over the Very Long Run
- Key messages:
o Sustained increases in SoL are a recent phenomenon.
o Economic growth emerges in different places at different times.
- Modern Economic Growth:
o From 1870 to 2008: US real GDP/capita increases by 15x
o Other observations but no real important theory.
Importance?
- GDP facilitates cross-country comparisons
- It’s also a measure of productive capacity -> which is a crucial factor for improvements in
development (I.e., health and other welfare-related dimensions)
- The correlation between GDP/capita and HDI is strong and positive
Model of Production. (Video 2)
Rationale: Explain the differences in economic performance between countries
Environment of the Economy
- Parameters:
o Single, closed economy
o 1 consumption good
o Households are exogenous
o Two inputs: Labour (L), and Capital (K)
o Production function: how much output (Y) can be produced given any number of inputs
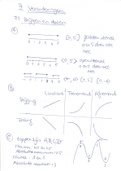
- Cobb-Douglas Production Function
α 1−α
Y=A K L
- ( Y ) is the output, ( ( K ) ∧( L ) )are the production inputs, α parameter controlling the importance of
capital (vs labor) in production, A is the total factor productivity (tech) (TFP)
- 3 ways to achieve economic growth (increase in Y)
o Capital accumulation
, o Labor force increases
o Technological changes
- Note:
o The function is strictly increasing in both inputs (MPK and MPL > 0)
o There is decreasing marginal products (2nd derivatives of K and L)
o There are constant returns to scale
- Under CRS, dividing the output by the number of workers, we obtain:
Y
L
=F
K
L( )
,1
- We can write output per worker as:
y=f ( k )
Y K
- Where y= ∧k =
L L
- Lowercase letters denote per worker quantities
Continued:
- We want to maximize profits
- π=tot . rev .−tot . c ⇒ π= pY −rK −wL
- Max. Profit.:
max ❑ F ( K , L )−rK −wL
K ,L
- Maximize profit by choosing capital and labor levels. We look for the FOC of the profit function
s.t K & L. Essentially calculate MPK=MCK and MPL=MCL
- The FOC reveals that the marginal products are equal to the marginal cost.
Households
- Supply K and L and demand Y
- If we assume that the supply of K and L is exogenously given this implies the supply curve of
each is perfectly inelastic (vertical)
- Also, if households demand the entire production, all quantities will be bought up.
General Equilibrium
- Eq.: value of all endogenous quantities and prices s.t all markets clear
- Market for K, L and the output produced Y.
, -
- To solve for the model, we will resolve a system of 5 equations:
¿
1. K =K
¿
2. L =L
3. Y ¿ = A K ¿α L¿1−α
¿
4. r =α A ¿ ¿
¿
5. w = ( 1−α ) A ¿ ¿
Observations
- Firms employ all the supplied capital and labor
- The eq. Wage is proportional to output per worker
- The eq. Rental rate is proportional to capital ratio
- Firms make 0 profits <- Perfect competition
Development Accounting (Video 3)
Applications of the Model
- Idea: use the production function to account for cross-country differences in GDP per capita.
- We have y ¿ = A k α
- Research Sub-Q:
o How are cross-country differences in y ¿due to cross-country differences in k
o Can the model explain the data if we set A (Level of prod.) for all countries
Implementation:
- National Accounts and other sources provide k estimates for many countries.
- To calibrate α , we use the fact that C-D functions and competitive markets imply:
r ¿ K ¿ α ∧w ¿ L¿
= =1−α
Y¿ Y¿
- Where α is the capital share of income, and 1−α is the labor share of income
- This is an example of calibration: setting model parameters to match empirical facts
Applications and Key Results
, - If the TFP is normalized to 1 for all countries, the model under-predicts cross-country gaps in
GDP/capita
- Observed cross-country gaps in k are not large enough to explain observed cross-country gaps in
y
o TFP should be wildly different across countries
o We can compute the country specific TFP to match differences in GDP
What is TFP?
- In the model (TFP) is represented by the parameter A
o Also called the technology parameter
- Empirically, it is the portion of output not explained by the number of inputs used in production
- TFP -> measures residual growth in total output of a firm, industry or national economy, not
explained by the accumulation of traditional inputs (K & L)
Understanding TFP differences
- Output differences between the richest and poorest countries
o Differences in capital per person explain 1 third of the difference
o TFP differences explain the remaining difference
- Possible explanations: tech; human capital; institutions; cultures; capital misallocation
Facts and Questions about Growth
- GDP: main measure of aggregate economic activity. The market value of final goods and services
produced in an economy each year.
Measuring the Economic
- PPP-Adjusted Real GDP per capita
o When computing changes over time, we fix prices at a given baseline year (‘real’)
o When comparing different countries, we fix a set of international prices (‘PPP’). This is
useful since prices are generally higher in rich countries.
Growth Over the Very Long Run
- Key messages:
o Sustained increases in SoL are a recent phenomenon.
o Economic growth emerges in different places at different times.
- Modern Economic Growth:
o From 1870 to 2008: US real GDP/capita increases by 15x
o Other observations but no real important theory.
Importance?
- GDP facilitates cross-country comparisons
- It’s also a measure of productive capacity -> which is a crucial factor for improvements in
development (I.e., health and other welfare-related dimensions)
- The correlation between GDP/capita and HDI is strong and positive
Model of Production. (Video 2)
Rationale: Explain the differences in economic performance between countries
Environment of the Economy
- Parameters:
o Single, closed economy
o 1 consumption good
o Households are exogenous
o Two inputs: Labour (L), and Capital (K)
o Production function: how much output (Y) can be produced given any number of inputs
- Cobb-Douglas Production Function
α 1−α
Y=A K L
- ( Y ) is the output, ( ( K ) ∧( L ) )are the production inputs, α parameter controlling the importance of
capital (vs labor) in production, A is the total factor productivity (tech) (TFP)
- 3 ways to achieve economic growth (increase in Y)
o Capital accumulation
, o Labor force increases
o Technological changes
- Note:
o The function is strictly increasing in both inputs (MPK and MPL > 0)
o There is decreasing marginal products (2nd derivatives of K and L)
o There are constant returns to scale
- Under CRS, dividing the output by the number of workers, we obtain:
Y
L
=F
K
L( )
,1
- We can write output per worker as:
y=f ( k )
Y K
- Where y= ∧k =
L L
- Lowercase letters denote per worker quantities
Continued:
- We want to maximize profits
- π=tot . rev .−tot . c ⇒ π= pY −rK −wL
- Max. Profit.:
max ❑ F ( K , L )−rK −wL
K ,L
- Maximize profit by choosing capital and labor levels. We look for the FOC of the profit function
s.t K & L. Essentially calculate MPK=MCK and MPL=MCL
- The FOC reveals that the marginal products are equal to the marginal cost.
Households
- Supply K and L and demand Y
- If we assume that the supply of K and L is exogenously given this implies the supply curve of
each is perfectly inelastic (vertical)
- Also, if households demand the entire production, all quantities will be bought up.
General Equilibrium
- Eq.: value of all endogenous quantities and prices s.t all markets clear
- Market for K, L and the output produced Y.
, -
- To solve for the model, we will resolve a system of 5 equations:
¿
1. K =K
¿
2. L =L
3. Y ¿ = A K ¿α L¿1−α
¿
4. r =α A ¿ ¿
¿
5. w = ( 1−α ) A ¿ ¿
Observations
- Firms employ all the supplied capital and labor
- The eq. Wage is proportional to output per worker
- The eq. Rental rate is proportional to capital ratio
- Firms make 0 profits <- Perfect competition
Development Accounting (Video 3)
Applications of the Model
- Idea: use the production function to account for cross-country differences in GDP per capita.
- We have y ¿ = A k α
- Research Sub-Q:
o How are cross-country differences in y ¿due to cross-country differences in k
o Can the model explain the data if we set A (Level of prod.) for all countries
Implementation:
- National Accounts and other sources provide k estimates for many countries.
- To calibrate α , we use the fact that C-D functions and competitive markets imply:
r ¿ K ¿ α ∧w ¿ L¿
= =1−α
Y¿ Y¿
- Where α is the capital share of income, and 1−α is the labor share of income
- This is an example of calibration: setting model parameters to match empirical facts
Applications and Key Results
, - If the TFP is normalized to 1 for all countries, the model under-predicts cross-country gaps in
GDP/capita
- Observed cross-country gaps in k are not large enough to explain observed cross-country gaps in
y
o TFP should be wildly different across countries
o We can compute the country specific TFP to match differences in GDP
What is TFP?
- In the model (TFP) is represented by the parameter A
o Also called the technology parameter
- Empirically, it is the portion of output not explained by the number of inputs used in production
- TFP -> measures residual growth in total output of a firm, industry or national economy, not
explained by the accumulation of traditional inputs (K & L)
Understanding TFP differences
- Output differences between the richest and poorest countries
o Differences in capital per person explain 1 third of the difference
o TFP differences explain the remaining difference
- Possible explanations: tech; human capital; institutions; cultures; capital misallocation