Introduction to research in Marketing
Week 1
HBBA: Chapter 1
HBBA = Broadly speaking, it refers to all statistical methods that simultaneously analyze multiple
measurements on each individual or object under investigation.
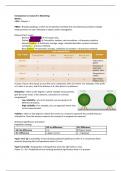
Measurement scales:
- Nominal (non-metric) à Chi-square test
- Ordinal (non-metric) à Percentiles, median, rank correlation + all previous statistics
- Interval (metric) à Arithmetic average, range, standard deviation, product-moment
correlation + previous methods
- Ratio (metric) à Geometric average, coefficient of variation + all previous methods
If value of your ratio equals to zero (the zero is abstance), then isn’t there. For example, if the profit
is 0, there is no zero, and if the distance is 0, then there is no distance.
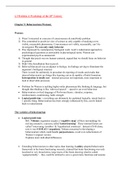
Reliability = refers to the degree in which multiple measurements
give the same result. Is the measure, consistent or correctly
reregistered?
- Low reliability = you are trying but, you are going in all
different directions.
- High reliability = for example, you can approach every shot
as one measurement.
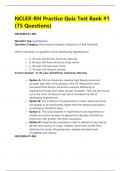
Validity = refers to the degree to which the scores on a measure represent the variable they are
intended to. Does the measure capture the concept it is supposed to measure?
Statistical significance and power
Hypothesis testing:
H0: no difference H1: Difference
H0: No difference 1-a ß (Type II error)
H1: Difference a (type I error) 1 – ß (power)
Type I error (a) = probability of test showing statistical significance when it is not present (false
positive) (rejecting the null hypothesis when it’s true.
Type II error (ß) = Keeping the null hypothesis when the alternative is true.
Power (1 – ß) = Probability of test showing statistical significance when it is present.
,Power depends on:
- A larger p-value (+)
- Effect size (+)
- Sample size n (+)
Implications:
- Anticipate consequences of a, effect and n
- Assess/incorporate power when interpreting results.
If we are willing to settle for a higher alpha than it means our power will increase. When you willing
to set a higher alpha, you are saying that you are taking a higher risk.
Types of multivariate methods:
Dependence techniques:
- One or more variables can be identified as dependent variables and the remaining as
independent variables.
- Choice of dependence technique depends on the number of dependent variables involved in
analysis.
- Looking for a causal relationship.
Interdependence techniques:
- Whole set of interdependent relationships is examined.
- Further classified as having focus on variable or object.
- Not looking for a causal relationship but looks at the whole group of variables and try to find
structure/pattern in there.
Outliers = observations with a unique combination of characteristics identifiable as distinctly
different from the other observations. Unusual observations.
- Good: true value (probably)
- Bad: something is wrong?
o To distinguish these types, one should investigate the causes
§ Procedural error
§ Exceptional circumstances (cause known or unknown)
§ Regular levels, yet unique in combination with other variables (bivariate and
multivariate outliers)
Bad outliers completely mess up the results.
How can we detect outliers:
- Univariate (histograms, TS plots, Frequency Tables, Means +/- 3SD, box plots)
- Bivariate (scatterplot, multiple histograms)
- Multivariate (Mahala Nobis D2 – not part of the course)
Keep it or delete outlier? à judgement call
- Only observations that truly deviate can be considered outliers
- Removing many outliers can jeopardize representativeness
Examining missing data:
Missing data lead to:
- Reduced sample size
- Possibly biased outcome if missing data process not random à 4 step approach for
identification and remedying
Steps in missing data analysis:
,1. Determine type of missing data: ignorable ß à non-ignorable missing?
2. Determine extent (%) of missing data: by variable, case, overall
3. Diagnose randomness of missing data: systematic, missing at random (MAR), missing
completely at random (MCAR)?
a. Are non-ignorable missing:
i. Systematic = linked to level of variable itself, another pattern?
ii. Missing at random (MAR) = whether Y is missing depends on level of X. Yet,
within level of X: missing at random
iii. Missing completely at random (MCAR) = whether Y is missing is truly
‘random’ (independent of Y or of any other variable X)
4. Deal with the missing data problem: remove cases or variables with missing values, use
imputation
, Week 1 – ANOVA (Dependence method)
ANOVA is a dependent method because we are looking for causal relationship. Minimum variable is
on nominal scale. Outcome variable to be metric, input variables are non-metric.
1. Defining objectives
a. Test whether treatments (categorical variables) lead to different levels for a (set of)
metric outcome variable.
i. Does online ad design, in particular: position of picture and logo, affect the
click-through rate?
Week 1
HBBA: Chapter 1
HBBA = Broadly speaking, it refers to all statistical methods that simultaneously analyze multiple
measurements on each individual or object under investigation.
Measurement scales:
- Nominal (non-metric) à Chi-square test
- Ordinal (non-metric) à Percentiles, median, rank correlation + all previous statistics
- Interval (metric) à Arithmetic average, range, standard deviation, product-moment
correlation + previous methods
- Ratio (metric) à Geometric average, coefficient of variation + all previous methods
If value of your ratio equals to zero (the zero is abstance), then isn’t there. For example, if the profit
is 0, there is no zero, and if the distance is 0, then there is no distance.
Reliability = refers to the degree in which multiple measurements
give the same result. Is the measure, consistent or correctly
reregistered?
- Low reliability = you are trying but, you are going in all
different directions.
- High reliability = for example, you can approach every shot
as one measurement.
Validity = refers to the degree to which the scores on a measure represent the variable they are
intended to. Does the measure capture the concept it is supposed to measure?
Statistical significance and power
Hypothesis testing:
H0: no difference H1: Difference
H0: No difference 1-a ß (Type II error)
H1: Difference a (type I error) 1 – ß (power)
Type I error (a) = probability of test showing statistical significance when it is not present (false
positive) (rejecting the null hypothesis when it’s true.
Type II error (ß) = Keeping the null hypothesis when the alternative is true.
Power (1 – ß) = Probability of test showing statistical significance when it is present.
,Power depends on:
- A larger p-value (+)
- Effect size (+)
- Sample size n (+)
Implications:
- Anticipate consequences of a, effect and n
- Assess/incorporate power when interpreting results.
If we are willing to settle for a higher alpha than it means our power will increase. When you willing
to set a higher alpha, you are saying that you are taking a higher risk.
Types of multivariate methods:
Dependence techniques:
- One or more variables can be identified as dependent variables and the remaining as
independent variables.
- Choice of dependence technique depends on the number of dependent variables involved in
analysis.
- Looking for a causal relationship.
Interdependence techniques:
- Whole set of interdependent relationships is examined.
- Further classified as having focus on variable or object.
- Not looking for a causal relationship but looks at the whole group of variables and try to find
structure/pattern in there.
Outliers = observations with a unique combination of characteristics identifiable as distinctly
different from the other observations. Unusual observations.
- Good: true value (probably)
- Bad: something is wrong?
o To distinguish these types, one should investigate the causes
§ Procedural error
§ Exceptional circumstances (cause known or unknown)
§ Regular levels, yet unique in combination with other variables (bivariate and
multivariate outliers)
Bad outliers completely mess up the results.
How can we detect outliers:
- Univariate (histograms, TS plots, Frequency Tables, Means +/- 3SD, box plots)
- Bivariate (scatterplot, multiple histograms)
- Multivariate (Mahala Nobis D2 – not part of the course)
Keep it or delete outlier? à judgement call
- Only observations that truly deviate can be considered outliers
- Removing many outliers can jeopardize representativeness
Examining missing data:
Missing data lead to:
- Reduced sample size
- Possibly biased outcome if missing data process not random à 4 step approach for
identification and remedying
Steps in missing data analysis:
,1. Determine type of missing data: ignorable ß à non-ignorable missing?
2. Determine extent (%) of missing data: by variable, case, overall
3. Diagnose randomness of missing data: systematic, missing at random (MAR), missing
completely at random (MCAR)?
a. Are non-ignorable missing:
i. Systematic = linked to level of variable itself, another pattern?
ii. Missing at random (MAR) = whether Y is missing depends on level of X. Yet,
within level of X: missing at random
iii. Missing completely at random (MCAR) = whether Y is missing is truly
‘random’ (independent of Y or of any other variable X)
4. Deal with the missing data problem: remove cases or variables with missing values, use
imputation
, Week 1 – ANOVA (Dependence method)
ANOVA is a dependent method because we are looking for causal relationship. Minimum variable is
on nominal scale. Outcome variable to be metric, input variables are non-metric.
1. Defining objectives
a. Test whether treatments (categorical variables) lead to different levels for a (set of)
metric outcome variable.
i. Does online ad design, in particular: position of picture and logo, affect the
click-through rate?