HOOFDSTUK 6: MANUFAC TURING PROCESSES
What is required to make something? Sourcing the parts we need, followed by making the item and then
sending the item to the customer.
Lead time is the time needed to respond to a customer order. Customer order decoupling point is where
inventory is positioned in the supply chain. Selection of CODP’s is a strategic decision that determines customer
lead times and can greatly impact inventory investment. The closer it is to the customer, the quicker the
customer can be served.
Make-to-stock is a production environment where the customer is served “on-demand” from finished
goods inventory. (televisions, clothing)
Assemble-to-order is a production environment where pre-assembled components, subassemblies,
and modules are put together in response to a specific customer order. (Dell)
Make-to-order is a production environment where the product is built directly from raw materials and
components in response to a specific customer order. (Boeing)
Engineer-to-order is when the firm works with the customer to design the product, which is then
made from purchased material, parts and components.
Many make-to-stock firms and also assemble-to-order firms invest in lean manufacturing programs in order to
achieve higher service levels for a given inventory investment. These exist to achieve high customer service
with minimum levels of inventory investment.
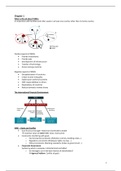
A simplified way of thinking about material in a process is that it is in one of two states: material is moving/”in-
transit” or material is sitting in inventory and is acting as a “buffer” waiting to be used. Material that is in a
manufacturing process in a factory can also be considered in-transit: “work-in-progress” inventory.
A common measure is the total average value of inventory in the process. This is the total investment in
inventory at the firm, which includes raw material, work-in-process, and finished goods. A better measure is
inventory turn, which is an efficiency measure where the cost of goods sold is divided by the average inventory
value (higher is better). A measure directly related is days-of-supply, which is a measure of the number of days
of supply of an item. Simple systems can be analysed quickly using Little’s law: mathematically relates
inventory, throughput and flow time. Inventory = throughput rate * flow time. Throughput is the long-term
average rate that items are flowing through the process. Flow time is the time that it takes a unit to flow
through the process from beginning to end.
The most common assembly line is a moving conveyor that passes a series of workstations in a uniform time
interval: workstation cycle time (the time between successive units coming off the end of an assembly line).
The total work to be performed at a workstation is equal to the sum of the tasks assigned to that workstation.
The assembly-line balancing problem is one of assigning all tasks to a series of workstations so that each
workstation has no more than can be done in the workstation cycle time and so that the unassigned time
across all workstations is minimized. The precedence relationship is the required order in which tasks must be
performed in an assembly process.
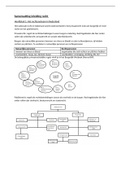
Steps in balancing an assembly line:
1. Specify the sequential relationships among tasks using a precedence diagram.
2. Determine the required workstation cycle time.
𝑝𝑟𝑜𝑑𝑢𝑐𝑡𝑖𝑜𝑛 𝑡𝑖𝑚𝑒 𝑝𝑒𝑟 𝑑𝑎𝑦
a. 𝐶 = 𝑟𝑒𝑞𝑢𝑖𝑟𝑒𝑑 𝑜𝑢𝑡𝑝𝑢𝑡 𝑝𝑒𝑟 𝑑𝑎𝑦 (𝑖𝑛 𝑢𝑛𝑖𝑡𝑠)
3. Determine the theoretical minimum number of workstations required to satisfy the workstation cycle
time constraint.
What is required to make something? Sourcing the parts we need, followed by making the item and then
sending the item to the customer.
Lead time is the time needed to respond to a customer order. Customer order decoupling point is where
inventory is positioned in the supply chain. Selection of CODP’s is a strategic decision that determines customer
lead times and can greatly impact inventory investment. The closer it is to the customer, the quicker the
customer can be served.
Make-to-stock is a production environment where the customer is served “on-demand” from finished
goods inventory. (televisions, clothing)
Assemble-to-order is a production environment where pre-assembled components, subassemblies,
and modules are put together in response to a specific customer order. (Dell)
Make-to-order is a production environment where the product is built directly from raw materials and
components in response to a specific customer order. (Boeing)
Engineer-to-order is when the firm works with the customer to design the product, which is then
made from purchased material, parts and components.
Many make-to-stock firms and also assemble-to-order firms invest in lean manufacturing programs in order to
achieve higher service levels for a given inventory investment. These exist to achieve high customer service
with minimum levels of inventory investment.
A simplified way of thinking about material in a process is that it is in one of two states: material is moving/”in-
transit” or material is sitting in inventory and is acting as a “buffer” waiting to be used. Material that is in a
manufacturing process in a factory can also be considered in-transit: “work-in-progress” inventory.
A common measure is the total average value of inventory in the process. This is the total investment in
inventory at the firm, which includes raw material, work-in-process, and finished goods. A better measure is
inventory turn, which is an efficiency measure where the cost of goods sold is divided by the average inventory
value (higher is better). A measure directly related is days-of-supply, which is a measure of the number of days
of supply of an item. Simple systems can be analysed quickly using Little’s law: mathematically relates
inventory, throughput and flow time. Inventory = throughput rate * flow time. Throughput is the long-term
average rate that items are flowing through the process. Flow time is the time that it takes a unit to flow
through the process from beginning to end.
The most common assembly line is a moving conveyor that passes a series of workstations in a uniform time
interval: workstation cycle time (the time between successive units coming off the end of an assembly line).
The total work to be performed at a workstation is equal to the sum of the tasks assigned to that workstation.
The assembly-line balancing problem is one of assigning all tasks to a series of workstations so that each
workstation has no more than can be done in the workstation cycle time and so that the unassigned time
across all workstations is minimized. The precedence relationship is the required order in which tasks must be
performed in an assembly process.
Steps in balancing an assembly line:
1. Specify the sequential relationships among tasks using a precedence diagram.
2. Determine the required workstation cycle time.
𝑝𝑟𝑜𝑑𝑢𝑐𝑡𝑖𝑜𝑛 𝑡𝑖𝑚𝑒 𝑝𝑒𝑟 𝑑𝑎𝑦
a. 𝐶 = 𝑟𝑒𝑞𝑢𝑖𝑟𝑒𝑑 𝑜𝑢𝑡𝑝𝑢𝑡 𝑝𝑒𝑟 𝑑𝑎𝑦 (𝑖𝑛 𝑢𝑛𝑖𝑡𝑠)
3. Determine the theoretical minimum number of workstations required to satisfy the workstation cycle
time constraint.