Hospitality Operations Design
Example test – Statistics
1. Give an example of:
A nominal variable Gender
An ordinal variable Star classification
An interval variable Temperature in degrees
A ratio variable Weight in kilograms
2. For which purpose are the following statistical techniques used? Which measurement levels
are required for each technique?
Mode To see which figure occurs the most (nominal, ordinal, interval, ratio)
Median To find the middle number in an order of numbers from low to high (ordinal,
interval, ratio)
Mean To summarize a group of data, sum of scores / number of scores (interval,
ratio)
Standard deviation To see how much variation there is around the mean (interval, ratio)
T-test To see the differences between two groups (interval & ratio)
Chi-square To see relationship between nominal and ordinal variables
Correlation To see relationship between two scores: interval and ratio variables
Regression To give a prediction in terms of interval and ratio variable.
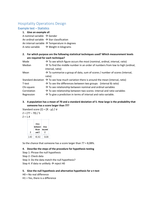
3. A population has a mean of 70 and a standard deviation of 5. How large is the probability that
someone has a score larger than 77?
Standard score (Z) = (X - µ) / σ
Z = (77 – 70) / 5
Z = 1.4
So the chance that someone has a score larger than 77 = 8,08%.
4. Describe the steps of the procedure for hypothesis testing
Step 1: Phrase the null hypothesis
Step 2: Check data
Step 3: Do the data match the null hypothesis?
Step 4: If data re unlikely reject H0
5. Give the null hypothesis and alternative hypothesis for a t-test
H0 = No real difference
H1 = Yes, there is a difference
Example test – Statistics
1. Give an example of:
A nominal variable Gender
An ordinal variable Star classification
An interval variable Temperature in degrees
A ratio variable Weight in kilograms
2. For which purpose are the following statistical techniques used? Which measurement levels
are required for each technique?
Mode To see which figure occurs the most (nominal, ordinal, interval, ratio)
Median To find the middle number in an order of numbers from low to high (ordinal,
interval, ratio)
Mean To summarize a group of data, sum of scores / number of scores (interval,
ratio)
Standard deviation To see how much variation there is around the mean (interval, ratio)
T-test To see the differences between two groups (interval & ratio)
Chi-square To see relationship between nominal and ordinal variables
Correlation To see relationship between two scores: interval and ratio variables
Regression To give a prediction in terms of interval and ratio variable.
3. A population has a mean of 70 and a standard deviation of 5. How large is the probability that
someone has a score larger than 77?
Standard score (Z) = (X - µ) / σ
Z = (77 – 70) / 5
Z = 1.4
So the chance that someone has a score larger than 77 = 8,08%.
4. Describe the steps of the procedure for hypothesis testing
Step 1: Phrase the null hypothesis
Step 2: Check data
Step 3: Do the data match the null hypothesis?
Step 4: If data re unlikely reject H0
5. Give the null hypothesis and alternative hypothesis for a t-test
H0 = No real difference
H1 = Yes, there is a difference