Tentamen (uitwerkingen)
Information_Visualization_Week3_NEC_Solved
Beoordeling
Verkocht
-
Pagina's
9
Cijfer
A+
Geüpload op
24-08-2023
Geschreven in
2023/2024
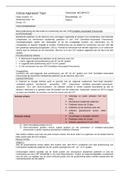
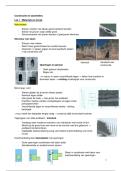
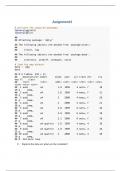
Create a scatter plot of gdp v life expectancy for five countries over a period of years. Show each country in a different color. Add a trend line. Comment your code line by line. Explain in a paragraph of at least five sentences what the chart is showing. Submit an R Markdown file with interpretations of each chart. Do not copy. Your work should be your own Your writing should be in your own words.
Meer zien
Lees minder
Instelling
Information Visualization
Vak
Information Visualization
Oeps! We kunnen je document nu niet laden. Probeer het nog eens of neem contact op met support.

Gekoppeld boek
Data Visualization
- 2018
- 9780691181622
- Onbekend
Geschreven voor
- Instelling
- Information Visualization
- Vak
- Information Visualization
Documentinformatie
- Geüpload op
- 24 augustus 2023
- Aantal pagina's
- 9
- Geschreven in
- 2023/2024
- Type
- Tentamen (uitwerkingen)
- Bevat
- Vragen en antwoorden
Onderwerpen
-
informationvisualizationweek3necsolved
€9,37
Krijg toegang tot het volledige document:
Verkeerd document? Gratis ruilen
Binnen 14 dagen na aankoop en voor het downloaden kun je een ander document kiezen. Je kunt het bedrag gewoon opnieuw besteden.
Geschreven door studenten die geslaagd zijn
Direct beschikbaar na je betaling
Online lezen of als PDF
Ook beschikbaar in voordeelbundel
Voordeelbundel
Information_Visualization_NEC_All_7_Weeks_Solved
8
2023
€ 75,00
Meer info