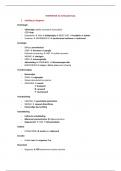
Lecture 11 – Critical thinking about psychological research
Something weird is going on:
- 96% of published research confirms the hypothesis (i.e. finds expected results), even if the power
is very low*
* Power failure:
estimates of actual power
achieved in most research
ranges from less than 0.50
to 0.35, or even 0.31
- a lot of replication studies fail to replicate the original findings
e.g. we tried to replicate 100 studies, most of which showed significant results. In most replications
the results were not significant, and the effect sizes were lower.
When conducting a study, researchers are faced with a lot of decisions on how to handle the data,
each leading to different results. The available options are the researcher degrees of freedom.
P.S. I say ‘the available options’ when in reality RDF represents the concept of flexibility in choosing.
Wrong to think that if an effect
These influence the p-value. is significant with a small n
then it would necessarily be
Researcher Degrees of Freedom: significant with a larger n.
• Which research area?
• Which theory?
• Which hypotheses?
• How many DV?
• How many conditions (IV)?
• How many participants?
• How to treat outliers?
• What measurement procedure?
• What analyses?
• What is an effect? What is a relevant effect?
• What can you conclude from the analyses?
• What can you conclude from the investigations?
Solutions to the flexibility-ambiguity problem (RDF)
Disclosure Requirements for authors:
Embrace the disclosure
• Decide the rule for terminating data collection beforehand requirements as if the
• Collect at least 20 observations per cell credibility of your
profession depends on
samples smaller than that are not powerful enough them. Because it does.
• List all variables
don’t describe, just list starting with “only”
• Report all experimental conditions
prevents from reporting only manipulations that worked; include the word “only”
• If observations are eliminated, report also the results if those are included
transparency; justification of elimination
• If a covariate is included in the analysis, report also the results without the covariate
covariate-free results make transparent the extent to which a finding relies on the presence
of the covariate
,Guidelines for reviewers:
• Ensure that the authors follow the requirements
to rule out alternative explanations and demonstrate that the findings are not due to chance
alone; transparency > tidiness
• Be more tolerant of imperfections in results
underpowered studies with perfect results are sketchy
• Require authors to demonstrate that their results don’t rely on arbitrary analytic decisions
these are inevitable, so we ought to make sure they are used consistently across studies
• If justification is not convincing, require exact replication
this solution is costly, it should be used selectively
Criticism of the solution
Not far enough
The solution doesn’t lead to the disclosure of all RDFs, especially those arising from reporting only
experiments that ‘work’.
We can solve this by requiring researchers to submit all studied to a public repository, turning
inconsequential omission (leaving out inconvenient facts) into consequential, potentially career-
ending commission (deliberately writing false statements).
Researchers have disincentives to disclose the used RDFs, which are eliminated by the
implementing of these disclosure requirements for authors from journals.
Too far
Guidelines prevent researchers from conducting exploratory research. So, when doing exploratory
research, we should report it as such (i.e. follow requirements) or complement it with confirmatory
research consisting of exact replications of the study (design & analysis) that worked in the
exploratory phase.
People are not checking on
Nonsolutions accuracy or appropriate
methodology; they just see
Alternatives to address the problem of RDF, but less practical/effective. if the story checks out
(strive for significance).
Correcting 𝛼 levels
Using the Bonferroni method, as in multiple hypo testing.
But 1) it is unclear which RDFs (out of many) contribute to the findings aka what their effect is on
the false positive rate; and 2) there is no exact rule on how to adjust alphas for each RDF or for
combinations of RDFs.
Using Bayesian statistics
It would actually increase RDFs, by 1) offering a new set of analyses; and 2) making additional
judgements (e.g. prior distribution) on a case-to-case basis.
Conceptual replications
It does not bind researchers to make the same analytic decisions across studies.
Posting materials and data
This is nice but it doesn’t help to address the problem, plus it would impose a high cost on readers
and reviewers (who would have to download data and run analyses).
,What is rewarded is the publication of significant results (defining ‘success’), and consequently the
use of RDF.
NHST fosters black-and-white thinking, where significant results are more rewarding than non-sig.
Because of the incentive structures in science, researchers are tempted to make decisions in a way
that leads to significant results,
encouraged by publication bias.
Publication bias:
Significant results are more
likely to get published
These incentive structures are not ideal: what is the best outcome for individual scientists may not
be the best outcome for science as a whole.
Why do we use statistical tests to run analyses? Why don’t we just write down the results
Besides standardization of steps and making inferences about the population (generalization), I use
statistical tests to explain the difference I found in terms of what produced it: randomness
(unsystematic variation)? Systematic variation? Both?
Why do we use p-values tho?
I want to be the devil’s advocate. To do so, I need to be able to make the argument ‘How likely is this
test statistic if there was no difference in the population?’
Rejecting/accepting the null hypothesis is a sort of practical reasoning: I need to consider the
utility of such decisions and the expected value of each possible outcome:
Devil’s advocate:
If it was just random noise,
how likely would these
results be?
When choosing 𝛼 and 𝛽 levels, if we go respectively for 0.05 and 0.20 because ‘everyone does it’, we
engage in the common practice fallacy. Usually, people go for the default values, although it depends
on the type of research you’re conducting.
Going for the default values means you care more about Type I error (whose acceptable error rate
is lower than that of Type II).
You consider Type I to be more serious, since it is easier to make and more costly in terms of
consequences.
Type I error – pursue effect that doesn’t exist
Type II error – ignore effect that exists
, TYPE I ERROR
- If I compare a randomly assigned random sample to one variable, the type I error rate is
0.05.
- If I make multiple comparisons (e.g. group A/B on V income; group A/C on Vextraversion; group
C/B on VIQ; group A/C on Vextraversion and so on) the collective type I error rate is much
greater than 0.05.
If we don’t correct for this rate, the research practice becomes questionable.
Greater Type I error rate when:
- comparing multiple DVs
- comparing multiple groups
- testing a difference with/without including a covariate
A researcher is more likely to find a (falsely) significant result than a (truly) nonsignificant one.
People are self-serving in their interpretation of ambiguous info, tending to conclude (with
convincing self-justification) that the appropriate decisions (RDF) are those that result in statistical
significance.
p-hacking aka exploiting RDFs until p < 0.05
may arise from the combo of pressure and temptation to report significant results for publication.
continuing data collection until a significant result is found (guarantees type I error)
p-hacking:
p-hacking and HARKing are
• Selective reporting of significant p-values
RDF that closely relate to NHST
• Trying multiple analyses (i.e. fitting different
statistical models) but reporting only the one that
‘worked’ they are not mutually exclusive
• Stopping data collection at a point other than that i.e. I might p-hack to find a significant
decided beforehand result that then I HARK
• Including data based on their effect on the p-value.
BUT p-curves probably
indicate very little about
Approaches to spot p-hacking: whether p-hacking occurred
• Looking at distribution of expected p-values if p-hacking happens vs that if it doesn’t.
• The p-curve (reporting expected number of p-values for each value of p), showing that smaller p-values
are more
frequently reported, mostly those just below threshold. This is seen as evidence for p-hacking.
• Tests of excess success aka multiple experiments (e.g. if a scientist reports four studies on the same
effect, based on the effect size and the sample size we can estimate the likelihood of getting a significant
result in all four. If this probability is low, significance in all four is ‘too good to be true’)
• Look for a bump just below the 0.05 threshold
HARKing – Hypothesizing After Results are Known
Presenting a hypothesis made after data collection as if it were made before.
(pretending the results you got were expected all along)
JARKing – Justifying After Results are Known