PROBLEM 1
CHAPTERS 1 AND 3 + LECTURE NOTES
PSYCHOLOGICAL TESTS = Must have high quality because of the real-life impact
A systematic procedure (standardized) that detects differences between people (interindividual differences) or
within a person, across time and situations (intraindividual differences)
Inference from an observable behavior -> To an unobservable psychological attribute
Theory should link a psychological characteristic to an observable behavior
Theory that is used to explain differences in behavior (e.g., working memory):
o Measured with operational definitions (e.g., number of recalled words)
o Hypothetical construct (or latent variable) = Concept that cannot be directly observable
A systematic procedure (standardized) that detects differences between people (interindividual differences) or
within a person, across time and situations (intraindividual differences)
IMPLICATIONS
1. Complexity of psychological phenomena = Difficulty in capture important aspects in a single score (e.g. anxiety)
2. Participants reactivity = People’s response might be influenced
o Demand characteristics -> Change behavior to accommodate the researcher
o Social desirability -> Change behavior to impress the person doing the measurement
o Malingering -> Change behavior to convey a poor impression to the person doing the measurement
3. Experimenter bias & expectations = Measurement quality compromised
o Observer bias (or scores) = It is likely to occur for physical scientist that rely on mechanical devices
4. Score sensitivity = Ability to discriminate between meaningful amounts of the dimension being measured
o Procedure might not be sensitive enough to discriminate (e.g., Feeling good or bad scale vs extremely good to
extremely bad)
5. Lack of awareness of important psychometric information = Often tests are conducted with little or no regard
6. Composite scores
CHAPTER 3
Central tendency = Typical score or most representative in a distribution -> Mean, median, mode
Variance = How much scores spread around the mean -> Variance and standard deviation
o Variance cannot be negative (less than zero)
o Cannot interpret as “small” or “large” without a context or comparison
o It is mostly important for the effect on other values more directly interpretable (e.g., correlation-reliability)
Covariance = Measures the direction of the relationship between two variables
o The association can be either positive or negative but does not reflect the magnitude
Correlation = Measures the direction and magnitude of the relationship between two variables
o The association can be either positive or negative (-1 to 1) and does reflect the magnitude (strong vs weak)
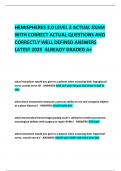
VARIANCE-COVARIANCE MATRIX
Set of variances and covariances captured in square matrices of values, presented on the diagonal line from the
upper left to the bottom right of the matrix
The matrix is symmetric = The values below the diagonal are identical to those above -> CXY = CYX
, SCORES
Composite scores = All numbers are added up
Variance of composite scores = All the numbers’ variance are added up + the correlations of the standard
deviation of the items
INTERPRETING TEST SCORES
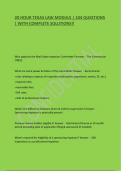
Raw scores are often difficult to interpret -> They can be transformed in z-scores or t-scores
x−x̄
o Z-scores = Interpreted in standard deviations away from the mean z =
Sx
o T-scores = Scores converted with a new mean and new standard deviation -> T = z (snew) + x̄ new
o Percentile ranks = Scores converted into percentiles that show people that score the same or lower than x
Not normal distribution = Use frequency table and continuity correction
NORMALIZED SCORES
Scores not normally distributed that can be transformed into a normal ones by:
o Transforming original raw score into a percentile rank
o Convert percentile rank into a z-score
o Convert z-score into a new score with desired mean and standard deviation to resemble a normal distribution
Problem 2
TEST DIMENSIONALITY AND FACTOR ANALYSIS
Test dimensionality = How many factors a test is measuring (e.g., Social anxiety, intelligence etc.)
Factor analysis = Method used to identify the number of dimensions reflected by a test, the meaning of those
dimensions, and the degree to which the dimensions are associated with each other
-> Easiest form of construct validity (Are the factors reflected by the questionnaire?)
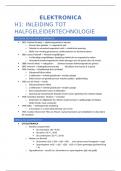
Test can have 2 dimensions:
o Unidimensional tests
o Multidimensional tests with correlated or uncorrelated dimensions (more common)
THREE DIMENSIONALITY QUESTIONS
1. How many dimensions are reflected in the test items? (e.g., Only one or more)
2. If more than one, are dimensions correlated with each other?
3. If more than one, what are those dimensions? What psychological attributes are reflected by the test
dimensions?
UNIDIMENSIONAL TESTS
A single attribute reflect a psychological dimension = Items all measure the same thing (correlation)
Implications = All items are combined in some way (sum, average, counting) to form a composite “total” score
-> Reliability and validity should be evaluated
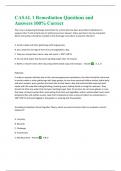
MULTIDIMENSIONAL TESTS WITH CORRELATED DIMENSIONS
More than one psychological attribute correlated with each other (e.g., ADHD test) -> High score on a subtest, likely
to score high on another subset and other way around
Each subset has its own subset score (which is unidimensional) -> All scores are combined to produce a total
one (summing or averaging) and should be evaluated with regard to psychometric quality
CHAPTERS 1 AND 3 + LECTURE NOTES
PSYCHOLOGICAL TESTS = Must have high quality because of the real-life impact
A systematic procedure (standardized) that detects differences between people (interindividual differences) or
within a person, across time and situations (intraindividual differences)
Inference from an observable behavior -> To an unobservable psychological attribute
Theory should link a psychological characteristic to an observable behavior
Theory that is used to explain differences in behavior (e.g., working memory):
o Measured with operational definitions (e.g., number of recalled words)
o Hypothetical construct (or latent variable) = Concept that cannot be directly observable
A systematic procedure (standardized) that detects differences between people (interindividual differences) or
within a person, across time and situations (intraindividual differences)
IMPLICATIONS
1. Complexity of psychological phenomena = Difficulty in capture important aspects in a single score (e.g. anxiety)
2. Participants reactivity = People’s response might be influenced
o Demand characteristics -> Change behavior to accommodate the researcher
o Social desirability -> Change behavior to impress the person doing the measurement
o Malingering -> Change behavior to convey a poor impression to the person doing the measurement
3. Experimenter bias & expectations = Measurement quality compromised
o Observer bias (or scores) = It is likely to occur for physical scientist that rely on mechanical devices
4. Score sensitivity = Ability to discriminate between meaningful amounts of the dimension being measured
o Procedure might not be sensitive enough to discriminate (e.g., Feeling good or bad scale vs extremely good to
extremely bad)
5. Lack of awareness of important psychometric information = Often tests are conducted with little or no regard
6. Composite scores
CHAPTER 3
Central tendency = Typical score or most representative in a distribution -> Mean, median, mode
Variance = How much scores spread around the mean -> Variance and standard deviation
o Variance cannot be negative (less than zero)
o Cannot interpret as “small” or “large” without a context or comparison
o It is mostly important for the effect on other values more directly interpretable (e.g., correlation-reliability)
Covariance = Measures the direction of the relationship between two variables
o The association can be either positive or negative but does not reflect the magnitude
Correlation = Measures the direction and magnitude of the relationship between two variables
o The association can be either positive or negative (-1 to 1) and does reflect the magnitude (strong vs weak)
VARIANCE-COVARIANCE MATRIX
Set of variances and covariances captured in square matrices of values, presented on the diagonal line from the
upper left to the bottom right of the matrix
The matrix is symmetric = The values below the diagonal are identical to those above -> CXY = CYX
, SCORES
Composite scores = All numbers are added up
Variance of composite scores = All the numbers’ variance are added up + the correlations of the standard
deviation of the items
INTERPRETING TEST SCORES
Raw scores are often difficult to interpret -> They can be transformed in z-scores or t-scores
x−x̄
o Z-scores = Interpreted in standard deviations away from the mean z =
Sx
o T-scores = Scores converted with a new mean and new standard deviation -> T = z (snew) + x̄ new
o Percentile ranks = Scores converted into percentiles that show people that score the same or lower than x
Not normal distribution = Use frequency table and continuity correction
NORMALIZED SCORES
Scores not normally distributed that can be transformed into a normal ones by:
o Transforming original raw score into a percentile rank
o Convert percentile rank into a z-score
o Convert z-score into a new score with desired mean and standard deviation to resemble a normal distribution
Problem 2
TEST DIMENSIONALITY AND FACTOR ANALYSIS
Test dimensionality = How many factors a test is measuring (e.g., Social anxiety, intelligence etc.)
Factor analysis = Method used to identify the number of dimensions reflected by a test, the meaning of those
dimensions, and the degree to which the dimensions are associated with each other
-> Easiest form of construct validity (Are the factors reflected by the questionnaire?)
Test can have 2 dimensions:
o Unidimensional tests
o Multidimensional tests with correlated or uncorrelated dimensions (more common)
THREE DIMENSIONALITY QUESTIONS
1. How many dimensions are reflected in the test items? (e.g., Only one or more)
2. If more than one, are dimensions correlated with each other?
3. If more than one, what are those dimensions? What psychological attributes are reflected by the test
dimensions?
UNIDIMENSIONAL TESTS
A single attribute reflect a psychological dimension = Items all measure the same thing (correlation)
Implications = All items are combined in some way (sum, average, counting) to form a composite “total” score
-> Reliability and validity should be evaluated
MULTIDIMENSIONAL TESTS WITH CORRELATED DIMENSIONS
More than one psychological attribute correlated with each other (e.g., ADHD test) -> High score on a subtest, likely
to score high on another subset and other way around
Each subset has its own subset score (which is unidimensional) -> All scores are combined to produce a total
one (summing or averaging) and should be evaluated with regard to psychometric quality