CHAPTER 35
Polar Coordinates
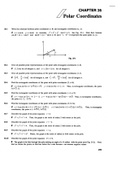
35.1 Write the relations between polar coordinates (r, 0) and rectangular coordinates (x, y).
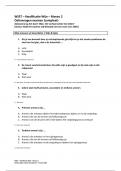
x = rcos0, y = rsin0; or, inversely, r2 = x2 + y2, ta.nO = y/x. See Fig. 35-1. Note that, because
cos (6 + ir) = -cos $ and sin (0 + ir) = -sin 0, (r, 0) and (-r, 0 + ir) represent the same point (jc, y).
Fig. 35-1
35.2 Give all possible polar representations of the point with rectangular coordinates (1,0).
(1,2irn) for all integers n, and (—1, (2n + I)TT) for all integers n.
35.3 Give all possible polar representations of the point with rectangular coordinates (1,1).
for all integers n, and for all integers n.
35.4 Find the rectangular coordinates of the point with polar coordinates (2, 77/6).
Thus, in rectangular coordinates, the point
35.5 Find the rectangular coordinates of the point with polar coordinates (—4, ir/3).
Thus, in rectangular coordinates,
the point is (-2, -2V5).
35.6 Find the rectangular coordinates of the point with polar coordinates (3,3ir/4).
Thus, in rectangular
coordinates, the point is
35.7 Describe the graph of the polar equation r = 2.
x2 + y2 = r2 = 4. Thus, the graph is the circle of radius 2 with center at the pole.
35.8 Describe the graph of the polar equation r = -2.
x2 + y2 = r2 - 4. Thus, the graph is the circle of radius 2 with center at the pole.
35.9 Describe the graph of the polar equation r = a.
x2 + y2 = r2 = a2. Hence, the graph is the circle of radius |a| with center at the pole.
35.10 Describe the graph of the polar equation 6 = trl4.
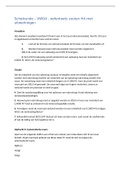
The graph is the line through the pole making an angle of ir/4 radian with the polar axis (Fig. 35-2). Note
that we obtain the points on that line below the *-axis because r can assume negative values.
289
,290 CHAPTER 35
Fig. 35-2
35.11 Describe the graph of the polar equation 0 = 0.
This is simply the line through the polar axis, or the x-axis in rectangular coordinates.
35.12 Write a polar equation for the y-axis.
0 - ir/2 yields the line perpendicular to the polar axis and going through the pole, which is the y-axis.
35.13 Describe the graph of the polar equation r = 2 sin ft
Multiplying both sides by r, we obtain r2 = 2r sin 0, x2 + y2 = 2y, x2 + y2 - 2y = 0, x2 + (y - I)2 = 1.
Thus, the graph is the circle with center at (0,1) and radius 1.
35.14 Describe the graph of the polar equation r = 4 cos ft
Multiplying both sides by r, we obtain r2 = 4r cos ft x2 + y2 = 4x, x2 -4x + y2 = 0, (x - 2)2 + y2 = 4.
Thus, the graph is the circle with center at (2,0) and radius 2.
35.15 Describe the graph of the polar equation r = tan 0 sec ft
r = sin 0/cos2 ft r cos2 0 = sin ft r2 cos2 0 = r sin ft, x2 = y. Thus, the graph is a parabola.
35.16 Describe the graph of the polar equation r = 6/V9 — 5 sin2 ft
r2 = 36/(9-5sin20), r2(9 - 5 sin2 ft) = 36, 9r2 - 5r2 sin2 0 = 36, 9(x2 + y2) - 5y2 = 36, 9*2 + 4/= 36,
The graph is an ellipse.
35.17 Describe the graph of the polar equation r = -10 cos ft
Multiply both sides by r: r = -Wr cos 0, x2 + y2 = -10*,
2
x2 + Wx + y2 = 0, (x + 5)2 + y2 = 25.
Thus, the graph is the circle with center (—5,0) and radius 5.
35.18 Describe the graph of the polar equation r = 6(sin 0 + cos 0).
Multiply both sides by r: r = 6r sin 0 + 6r cos ft x2 + y2 = 6y + 6x, x2 -6x + y2 -6y = 0, (AC - 3)2 +
2
(y - 3)2 = 18. Thus, the graph is the circle with center at (3,3) and radius 3V2.
35.19 Describe the graph of the polar equation r = 5 esc ft
r = 5/sin ft, r sin 0 = 5, y = 5. Thus, the graph is a horizontal line.
35.20 Describe the graph of the polar equation r = — 3 sec ft
r = —3/cos ft r cos 0 = —3, x = —3. Hence, the graph is a vertical line.
35.21 Change the rectangular equation x2 + y2 = 16 into a polar equation.
r2 = 16, r = 4 (or r=-4).
35.22 Change the rectangular equation x2 — y2 = 1 into a polar equation.
r 2 cos 2 0-r 2 sin 2 0 = l, r2(cos2 0 -sin2 0) = 1, r2cos20 = 1, r 2 = sec2ft
, POLAR COORDINATES 291
35.23 Transform the rectangular equation xy = 4 into a polar equation.
r cosfl -rsin 0 = 4, r2 sin 0 cos 0 = 4, r 2 (sin20)/2 = 4, r 2 = 8csc20.
35.24 Transform the rectangular equation x = 3 into a polar equation.
/•cos 6=3, r = 3secft
35.25 Transform the rectangular equation x + 2y = 3 into a polar equation.
rcos0 + 2rsin0 = 3, r(cos 0 + 2 sin 0) = 3, r = 3/(cos 0 + 2sin 0).
35.26 Find a rectangular equation equivalent to the polar equation 0 = 77/3.
tan 0 = tan (77/3) = VS. Hence, y/x = V3, y = V3x.
35.27 Find a rectangular equation equivalent to the polar equation r = tan 0.
~y/x, x2 + y2 = y2/x2, y2 = x2(x2 + y2), y2 = x* + x2y2, y2(l-x2) = x4, y2 = x</(l-x2).
35.28 Show that the point with polar coordinates (3,377/4) lies on the curve r = 3 sin 20.
Observe that r = 3, 0 = 377/4 do not satisfy the equation r = 3sin20. However (Problem 35.1), the
point with polar coordinates (3, 377/4) also has polar coordinates (—3, ?77/4), and r=— 3, 0 = 77r/4 satisfy
the equation r = 3sin20, since 3 sin 2(7 77/4) = 3sin(777-/2) = 3(-l) = -3.
35.29 Show that the point with polar coordinates (3,377/2) lies on the curve with the polar equation r2 = 9 sin 0.
Notice that r = 3, 0 = 3i7/2 do not satisfy the equation r 2 = 9sin0. However, the point with polar
coordinates (3,377/2) also has polar coordinates (-3, 7r/2), and r = -3, 0 = 77/2 satisfy the equation
r2 = 9 sin 0, since (-3)2 = 9 • 1.
35.30 Sketch the graph of r = 1 + cos ft
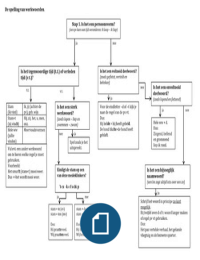
See Fig. 35-3. At 0 = 0, r = 2. As 0 increases to 77/2, r decreases to 1. As 0 increases to 77, r decreases
to 0. Then, as 0 increases to 377/2, r increases to 1, and finally, as 0 increases to 2i7, r increases to 2. After
0 = 277, the curve repeats itself. The graph is called a cardioid.
e 0 IT/2 •n 3ir/2 2 17
r 2 1 0 1 2
Fig. 35-3 Fig. 35-4
35.31 Sketch the graph of r = 1 + 2 cos 0.
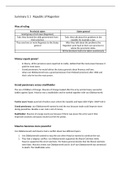
See Fig. 35-4. As 0 goes from 0 to 77/2, r decreases from 3 to 1. As 0 increases further to 277/3, r decreases
to 0. As 0 goes on to 77, r decreases to — 1, and then, as 0 moves up to 477/3, r goes back up to 0. As 0 moves on
to 377/2, r goes up to 1, and, finally, as 0 increases to 277, r grows to 3. This kind of graph is called a limacon.
0 0 it 12 277/3 IT 47T/3 37T/2 27T
r 3 1 0 -1 0 1 3
Polar Coordinates
35.1 Write the relations between polar coordinates (r, 0) and rectangular coordinates (x, y).
x = rcos0, y = rsin0; or, inversely, r2 = x2 + y2, ta.nO = y/x. See Fig. 35-1. Note that, because
cos (6 + ir) = -cos $ and sin (0 + ir) = -sin 0, (r, 0) and (-r, 0 + ir) represent the same point (jc, y).
Fig. 35-1
35.2 Give all possible polar representations of the point with rectangular coordinates (1,0).
(1,2irn) for all integers n, and (—1, (2n + I)TT) for all integers n.
35.3 Give all possible polar representations of the point with rectangular coordinates (1,1).
for all integers n, and for all integers n.
35.4 Find the rectangular coordinates of the point with polar coordinates (2, 77/6).
Thus, in rectangular coordinates, the point
35.5 Find the rectangular coordinates of the point with polar coordinates (—4, ir/3).
Thus, in rectangular coordinates,
the point is (-2, -2V5).
35.6 Find the rectangular coordinates of the point with polar coordinates (3,3ir/4).
Thus, in rectangular
coordinates, the point is
35.7 Describe the graph of the polar equation r = 2.
x2 + y2 = r2 = 4. Thus, the graph is the circle of radius 2 with center at the pole.
35.8 Describe the graph of the polar equation r = -2.
x2 + y2 = r2 - 4. Thus, the graph is the circle of radius 2 with center at the pole.
35.9 Describe the graph of the polar equation r = a.
x2 + y2 = r2 = a2. Hence, the graph is the circle of radius |a| with center at the pole.
35.10 Describe the graph of the polar equation 6 = trl4.
The graph is the line through the pole making an angle of ir/4 radian with the polar axis (Fig. 35-2). Note
that we obtain the points on that line below the *-axis because r can assume negative values.
289
,290 CHAPTER 35
Fig. 35-2
35.11 Describe the graph of the polar equation 0 = 0.
This is simply the line through the polar axis, or the x-axis in rectangular coordinates.
35.12 Write a polar equation for the y-axis.
0 - ir/2 yields the line perpendicular to the polar axis and going through the pole, which is the y-axis.
35.13 Describe the graph of the polar equation r = 2 sin ft
Multiplying both sides by r, we obtain r2 = 2r sin 0, x2 + y2 = 2y, x2 + y2 - 2y = 0, x2 + (y - I)2 = 1.
Thus, the graph is the circle with center at (0,1) and radius 1.
35.14 Describe the graph of the polar equation r = 4 cos ft
Multiplying both sides by r, we obtain r2 = 4r cos ft x2 + y2 = 4x, x2 -4x + y2 = 0, (x - 2)2 + y2 = 4.
Thus, the graph is the circle with center at (2,0) and radius 2.
35.15 Describe the graph of the polar equation r = tan 0 sec ft
r = sin 0/cos2 ft r cos2 0 = sin ft r2 cos2 0 = r sin ft, x2 = y. Thus, the graph is a parabola.
35.16 Describe the graph of the polar equation r = 6/V9 — 5 sin2 ft
r2 = 36/(9-5sin20), r2(9 - 5 sin2 ft) = 36, 9r2 - 5r2 sin2 0 = 36, 9(x2 + y2) - 5y2 = 36, 9*2 + 4/= 36,
The graph is an ellipse.
35.17 Describe the graph of the polar equation r = -10 cos ft
Multiply both sides by r: r = -Wr cos 0, x2 + y2 = -10*,
2
x2 + Wx + y2 = 0, (x + 5)2 + y2 = 25.
Thus, the graph is the circle with center (—5,0) and radius 5.
35.18 Describe the graph of the polar equation r = 6(sin 0 + cos 0).
Multiply both sides by r: r = 6r sin 0 + 6r cos ft x2 + y2 = 6y + 6x, x2 -6x + y2 -6y = 0, (AC - 3)2 +
2
(y - 3)2 = 18. Thus, the graph is the circle with center at (3,3) and radius 3V2.
35.19 Describe the graph of the polar equation r = 5 esc ft
r = 5/sin ft, r sin 0 = 5, y = 5. Thus, the graph is a horizontal line.
35.20 Describe the graph of the polar equation r = — 3 sec ft
r = —3/cos ft r cos 0 = —3, x = —3. Hence, the graph is a vertical line.
35.21 Change the rectangular equation x2 + y2 = 16 into a polar equation.
r2 = 16, r = 4 (or r=-4).
35.22 Change the rectangular equation x2 — y2 = 1 into a polar equation.
r 2 cos 2 0-r 2 sin 2 0 = l, r2(cos2 0 -sin2 0) = 1, r2cos20 = 1, r 2 = sec2ft
, POLAR COORDINATES 291
35.23 Transform the rectangular equation xy = 4 into a polar equation.
r cosfl -rsin 0 = 4, r2 sin 0 cos 0 = 4, r 2 (sin20)/2 = 4, r 2 = 8csc20.
35.24 Transform the rectangular equation x = 3 into a polar equation.
/•cos 6=3, r = 3secft
35.25 Transform the rectangular equation x + 2y = 3 into a polar equation.
rcos0 + 2rsin0 = 3, r(cos 0 + 2 sin 0) = 3, r = 3/(cos 0 + 2sin 0).
35.26 Find a rectangular equation equivalent to the polar equation 0 = 77/3.
tan 0 = tan (77/3) = VS. Hence, y/x = V3, y = V3x.
35.27 Find a rectangular equation equivalent to the polar equation r = tan 0.
~y/x, x2 + y2 = y2/x2, y2 = x2(x2 + y2), y2 = x* + x2y2, y2(l-x2) = x4, y2 = x</(l-x2).
35.28 Show that the point with polar coordinates (3,377/4) lies on the curve r = 3 sin 20.
Observe that r = 3, 0 = 377/4 do not satisfy the equation r = 3sin20. However (Problem 35.1), the
point with polar coordinates (3, 377/4) also has polar coordinates (—3, ?77/4), and r=— 3, 0 = 77r/4 satisfy
the equation r = 3sin20, since 3 sin 2(7 77/4) = 3sin(777-/2) = 3(-l) = -3.
35.29 Show that the point with polar coordinates (3,377/2) lies on the curve with the polar equation r2 = 9 sin 0.
Notice that r = 3, 0 = 3i7/2 do not satisfy the equation r 2 = 9sin0. However, the point with polar
coordinates (3,377/2) also has polar coordinates (-3, 7r/2), and r = -3, 0 = 77/2 satisfy the equation
r2 = 9 sin 0, since (-3)2 = 9 • 1.
35.30 Sketch the graph of r = 1 + cos ft
See Fig. 35-3. At 0 = 0, r = 2. As 0 increases to 77/2, r decreases to 1. As 0 increases to 77, r decreases
to 0. Then, as 0 increases to 377/2, r increases to 1, and finally, as 0 increases to 2i7, r increases to 2. After
0 = 277, the curve repeats itself. The graph is called a cardioid.
e 0 IT/2 •n 3ir/2 2 17
r 2 1 0 1 2
Fig. 35-3 Fig. 35-4
35.31 Sketch the graph of r = 1 + 2 cos 0.
See Fig. 35-4. As 0 goes from 0 to 77/2, r decreases from 3 to 1. As 0 increases further to 277/3, r decreases
to 0. As 0 goes on to 77, r decreases to — 1, and then, as 0 moves up to 477/3, r goes back up to 0. As 0 moves on
to 377/2, r goes up to 1, and, finally, as 0 increases to 277, r grows to 3. This kind of graph is called a limacon.
0 0 it 12 277/3 IT 47T/3 37T/2 27T
r 3 1 0 -1 0 1 3