Lieve Göbbels
Business Analytics (JBM040)
Semester 1, 2021-2022
Business Analytics
Introduction 2
Prediction and causal inference 2
Probability theory 3
Finite sample properties 5
Large sample properties 6
OLS Estimation and Inference 7
OLS estimation 7
OLS assumptions 8
Hypothesis tests 10
Asymptotics 13
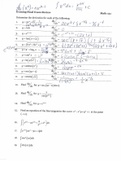
Functional Form and Qualitative Information 15
Introduction 15
Binary information 15
Nonlinear functions of one independent variable 16
Nonlinear functions of two independent variables 17
Instrumental Variable Estimation 18
Introduction 18
IV in a simple regression model 18
General IV regression model 20
Checking instrument validity 21
Heteroskedasticity 24
Introduction 24
Heteroskedasticity and inference 24
Testing for heteroskedasticity 25
Generalized least squares 26
Stationary Time Series Models 28
Introduction 28
Basics and transformations 28
Autocovariance and autocorrelation 28
Stationary and weak dependence 29
Autoregressive models 30
ADL models 32
Nonstationary Time Series Models 34
Introduction 34
Random walk 34
Unit roots 35
Unit root testing 36
Volatility models 38
, Introduction
In short:
• Prediction and causal inference
• Probability theory
• Finite sample properties
• Large sample properties
Prediction and causal inference
There are two different estimation problems that both use least squares for estimation: prediction
and causal inference. Prediction refers to the development of a formula for making predictions about
the dependent variable, based on the observed values of the independent variables (“what will
happen?” in short). Causal analysis refers to the idea that independent variables are regarded as
causes of the dependent variable, with the goal to determine whether a particular independent
variable really affects the dependent variable and, if any, to estimate the magnitude of that effect.
Regarding least squares, consider the data generating process (DGP) for a linear model:
y = β0 + β1 x1 + … + βk xk + u
where y = the outcome
x1, …, xk = the regressors
β0, β1, …, βk = the ‘true’ parameters
u ∼ N(0, σ 2 I ) = the error term
E(u | x) = 0
OLS then obtains the estimates β0̂ , β1̂ , …, βk̂ that minimize the sum of squared residuals. OLS
estimation has two goals:
1. predictive modeling: estimating the conditional mean with E(y | x)̂ = β0̂ + β1̂ x1 + … + βk̂ xk
2. causal estimation: estimating the partial derivative (slope parameter) w.r.t some xj with
∂E( y | x)̂
∂xj
= βĵ
The two goals have the same calculations, but have different quantities of interest.
For these goals to be achieved, the zero conditional mean assumption must be met:
E(u | x) = 0 such that E(y | x) = E(x β + u | x) = x β + E(u | x)
For prediction, interest is in the regression line that fits the data as close as possible and hence the
objective is to obtain the best fit to the data according to the LS criterion. Here, E(u | x) does not
play any role. For causal estimation, interest is in a particular βj, where the causal interpretation of βĵ
fails if E(u | xj ) ≠ 0. Instead, a bias estimate of βj is obtained.
Business Analytics (JBM040)
Semester 1, 2021-2022
Business Analytics
Introduction 2
Prediction and causal inference 2
Probability theory 3
Finite sample properties 5
Large sample properties 6
OLS Estimation and Inference 7
OLS estimation 7
OLS assumptions 8
Hypothesis tests 10
Asymptotics 13
Functional Form and Qualitative Information 15
Introduction 15
Binary information 15
Nonlinear functions of one independent variable 16
Nonlinear functions of two independent variables 17
Instrumental Variable Estimation 18
Introduction 18
IV in a simple regression model 18
General IV regression model 20
Checking instrument validity 21
Heteroskedasticity 24
Introduction 24
Heteroskedasticity and inference 24
Testing for heteroskedasticity 25
Generalized least squares 26
Stationary Time Series Models 28
Introduction 28
Basics and transformations 28
Autocovariance and autocorrelation 28
Stationary and weak dependence 29
Autoregressive models 30
ADL models 32
Nonstationary Time Series Models 34
Introduction 34
Random walk 34
Unit roots 35
Unit root testing 36
Volatility models 38
, Introduction
In short:
• Prediction and causal inference
• Probability theory
• Finite sample properties
• Large sample properties
Prediction and causal inference
There are two different estimation problems that both use least squares for estimation: prediction
and causal inference. Prediction refers to the development of a formula for making predictions about
the dependent variable, based on the observed values of the independent variables (“what will
happen?” in short). Causal analysis refers to the idea that independent variables are regarded as
causes of the dependent variable, with the goal to determine whether a particular independent
variable really affects the dependent variable and, if any, to estimate the magnitude of that effect.
Regarding least squares, consider the data generating process (DGP) for a linear model:
y = β0 + β1 x1 + … + βk xk + u
where y = the outcome
x1, …, xk = the regressors
β0, β1, …, βk = the ‘true’ parameters
u ∼ N(0, σ 2 I ) = the error term
E(u | x) = 0
OLS then obtains the estimates β0̂ , β1̂ , …, βk̂ that minimize the sum of squared residuals. OLS
estimation has two goals:
1. predictive modeling: estimating the conditional mean with E(y | x)̂ = β0̂ + β1̂ x1 + … + βk̂ xk
2. causal estimation: estimating the partial derivative (slope parameter) w.r.t some xj with
∂E( y | x)̂
∂xj
= βĵ
The two goals have the same calculations, but have different quantities of interest.
For these goals to be achieved, the zero conditional mean assumption must be met:
E(u | x) = 0 such that E(y | x) = E(x β + u | x) = x β + E(u | x)
For prediction, interest is in the regression line that fits the data as close as possible and hence the
objective is to obtain the best fit to the data according to the LS criterion. Here, E(u | x) does not
play any role. For causal estimation, interest is in a particular βj, where the causal interpretation of βĵ
fails if E(u | xj ) ≠ 0. Instead, a bias estimate of βj is obtained.