What is data mining?
Data mining is the computational process of discovering patterns in large datasets.
What are the related disciplines?
Artificial intelligence, machine learning and statistics.
What are the applications?
The actual extraction of knowledge from data using models. Examples are found in science
and business.
What is big data?
Big data is measured in volume, variety and velocity.
Volume: Variety:
Too big for manual analysis Big range of values
Too big to fit on RAM Outliers, confounders and noise
Too big to store on disk Different data types
Velocity:
Data changes quickly
Streaming, or online, data
Supervised and unsupervised learning
Supervised learning uses labeled data containing examples and the desired target variable.
Unsupervised learning uses unlabeled data with no target variable.
Examples of supervised and unsupervised learning
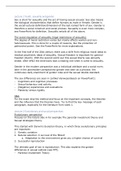
Supervised: linear regression. Describes the relationship between two variables and predicts
the value of one continuous variable based on another variable.
Supervised: classification. Classifies features into certain, known, groups based on their
characteristics.
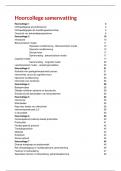
Unsupervised: dimensionality reduction. This is the process of reducing the number of
features into a set of principal, important features for analysis. This can be done through
feature selection or feature extraction.
Unsupervised: clustering. The grouping of similar datapoints that have no labels.
Unsupervised: association. Used to discover the co-occurrence of items in a database.
Workflow of supervised learning
1. Collect data
2. Label examples
3. Choose feature representation
,4. Train model
5. Evaluate model
Descriptive analysis: data visualization, exploring data distribution, detecting outliers,
testing hypotheses
A visualization of the data can give you an idea on how the data is distributed. This is usually
done with graphs. These visualizations make it possible to detect outliers in the data. The
testing of hypothesis can be done using statistical tests.
Representation of data
Data are represented by features. These can be numerical or categorical. It is possible to
convert features into a vector: a fixed-size list of values. Some algorithms require features
represented as vectors.
Learning and tuning - training set - validation set - test set
A model is said to learn if its performance in Tasks as measured by Performance improves
with Experience.
We sample, or split, our data into a training, validation and test set. We use stratification to
ensure all sets are structurally the same. We use a certain algorithm to build a model. We
train this model on the training set. We use the validation set to determine how well our
current parameter configuration performs and to tune the algorithm to see which
configuration performs best. We evaluate this ‘best’ model on our test set. Our test set thus
remains unseen until the very end.
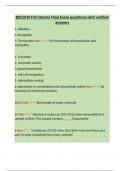
Collection of classified examples
Training examples Test set
Training set Validation set
Train Tune, evaluate Evaluate
Model Optimized
model
In general, we want to either 1) outperform state-of-the-art models doing the same task
(otherwise there is no need for us to train our own) or, if there is no such model 2) beat
some simple model. The latter is known as the baseline. For a linear regression, we can
check if the mean target value of the test set correspond with the mean target value of the
training examples. This baseline performs well if the target value is normally distributed. For
classification we can use the majority baseline; we check if the most frequent label in the
, test set correspond with the most frequent label in the training examples. This baseline
performs well if there is one common, dominant class.
Parameter or model tuning
Tuning can be informally defined as the process of selecting the hyperparameter value
reporting the highest performance value when evaluating the corresponding model on our
validation set. We can use this hyperparameter value for our test set.
Evaluation - generalisation - overfitting, underfitting
We want to evaluate models to see if our model correctly predicts our target. Data mining
experiments try to evaluate models on noisy sources to test if an observed pattern cannot
be subscribed to generalization errors. Any machine learning task can be formally evaluated
by comparing the true values of the target with the predicted values of the target.
Generalization can be defined as the ability of a model to correctly predict completely new
instances that are most dissimilar to the instances that we have seen. If we test on instances
that are similar, we would not get a good indication of generalization.
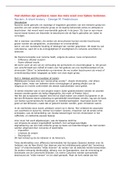
A model overfits when it’s capturing all the variance in the training examples. It won’t know
how to fit the new test data: the model is too complex.
A model underfits when it’s not predicting enough variance in the test set: the model is too
simple.
Correlation coefficient
Measures the strength of a linear relationship between two variables. An example is
Pearson’s r, calculated as follows:
r=
∑ (x−x )( y− y )
√∑ ( x−x)2 ∑ ( y − y)
2
Covariance
Is the measure of joint variability between two variables; to what extent do the variables
change together. It’s calculated in the numerator of the correlation coefficient:
n
∑ (X i− X)(Y i −Y )
i=1
cov ( X ,Y )=
n−1
Correlation versus causation
If two variables are correlated, it does not imply that one causes the other to happen. In
correlation, it is never sure what relationship two variables have. Correlation does not imply
causation. In causation, there is actual evidence that one variable causes effect in another.
Data mining is the computational process of discovering patterns in large datasets.
What are the related disciplines?
Artificial intelligence, machine learning and statistics.
What are the applications?
The actual extraction of knowledge from data using models. Examples are found in science
and business.
What is big data?
Big data is measured in volume, variety and velocity.
Volume: Variety:
Too big for manual analysis Big range of values
Too big to fit on RAM Outliers, confounders and noise
Too big to store on disk Different data types
Velocity:
Data changes quickly
Streaming, or online, data
Supervised and unsupervised learning
Supervised learning uses labeled data containing examples and the desired target variable.
Unsupervised learning uses unlabeled data with no target variable.
Examples of supervised and unsupervised learning
Supervised: linear regression. Describes the relationship between two variables and predicts
the value of one continuous variable based on another variable.
Supervised: classification. Classifies features into certain, known, groups based on their
characteristics.
Unsupervised: dimensionality reduction. This is the process of reducing the number of
features into a set of principal, important features for analysis. This can be done through
feature selection or feature extraction.
Unsupervised: clustering. The grouping of similar datapoints that have no labels.
Unsupervised: association. Used to discover the co-occurrence of items in a database.
Workflow of supervised learning
1. Collect data
2. Label examples
3. Choose feature representation
,4. Train model
5. Evaluate model
Descriptive analysis: data visualization, exploring data distribution, detecting outliers,
testing hypotheses
A visualization of the data can give you an idea on how the data is distributed. This is usually
done with graphs. These visualizations make it possible to detect outliers in the data. The
testing of hypothesis can be done using statistical tests.
Representation of data
Data are represented by features. These can be numerical or categorical. It is possible to
convert features into a vector: a fixed-size list of values. Some algorithms require features
represented as vectors.
Learning and tuning - training set - validation set - test set
A model is said to learn if its performance in Tasks as measured by Performance improves
with Experience.
We sample, or split, our data into a training, validation and test set. We use stratification to
ensure all sets are structurally the same. We use a certain algorithm to build a model. We
train this model on the training set. We use the validation set to determine how well our
current parameter configuration performs and to tune the algorithm to see which
configuration performs best. We evaluate this ‘best’ model on our test set. Our test set thus
remains unseen until the very end.
Collection of classified examples
Training examples Test set
Training set Validation set
Train Tune, evaluate Evaluate
Model Optimized
model
In general, we want to either 1) outperform state-of-the-art models doing the same task
(otherwise there is no need for us to train our own) or, if there is no such model 2) beat
some simple model. The latter is known as the baseline. For a linear regression, we can
check if the mean target value of the test set correspond with the mean target value of the
training examples. This baseline performs well if the target value is normally distributed. For
classification we can use the majority baseline; we check if the most frequent label in the
, test set correspond with the most frequent label in the training examples. This baseline
performs well if there is one common, dominant class.
Parameter or model tuning
Tuning can be informally defined as the process of selecting the hyperparameter value
reporting the highest performance value when evaluating the corresponding model on our
validation set. We can use this hyperparameter value for our test set.
Evaluation - generalisation - overfitting, underfitting
We want to evaluate models to see if our model correctly predicts our target. Data mining
experiments try to evaluate models on noisy sources to test if an observed pattern cannot
be subscribed to generalization errors. Any machine learning task can be formally evaluated
by comparing the true values of the target with the predicted values of the target.
Generalization can be defined as the ability of a model to correctly predict completely new
instances that are most dissimilar to the instances that we have seen. If we test on instances
that are similar, we would not get a good indication of generalization.
A model overfits when it’s capturing all the variance in the training examples. It won’t know
how to fit the new test data: the model is too complex.
A model underfits when it’s not predicting enough variance in the test set: the model is too
simple.
Correlation coefficient
Measures the strength of a linear relationship between two variables. An example is
Pearson’s r, calculated as follows:
r=
∑ (x−x )( y− y )
√∑ ( x−x)2 ∑ ( y − y)
2
Covariance
Is the measure of joint variability between two variables; to what extent do the variables
change together. It’s calculated in the numerator of the correlation coefficient:
n
∑ (X i− X)(Y i −Y )
i=1
cov ( X ,Y )=
n−1
Correlation versus causation
If two variables are correlated, it does not imply that one causes the other to happen. In
correlation, it is never sure what relationship two variables have. Correlation does not imply
causation. In causation, there is actual evidence that one variable causes effect in another.