HNE-37306
– APPLIED
DATA
ANALYSIS
EXTENDED SUMMARY OF THE
LECTURES AND KEY POINTS OF THE
PRACTICALS / E-MODULES
, APPLIED DATA ANALYSIS
1. PRACTICAL SPSS
- A bar chart provides a visual tool for categorical variables.
- A histogram provides a visual tool for continuous variables
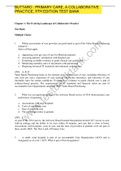
- A box plot is a nice tool to visually compare a continuous variables for two or more
groups.
Q1: 25th percentile
Q2: 50th percentile
Q3: 75th percentile
Q2 is the same as the median and since BMI is a continuous variable it’s also the
same as the mean.
2. TEN MODULES
E-MODULES
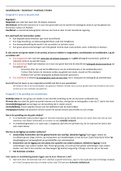
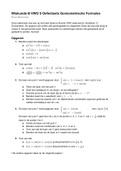
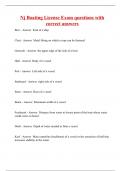
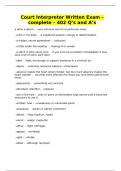
Type of variable Method of data analysis Effect
measure
2 continuous Linear regression β
variables
2 discrete Chi square, logistic OR, IPR, PR, OR case control
variables regression IRR PR cross sectional
IRR prospective cohort
Exposure = Ind. samples, paired Mean Paired samples cross-over trial
discrete samples, ANOVA difference Two-way ANOVA 2x2 factorial
outcome = design
continuous
Exposure = Logistic regression OR, IPR, PR, OR case control most common
continuous IRR one
outcome = PR cross sectional
discrete IRR prospective cohort
EFFECT MEASURE
Prevalence proportion – measures the proportion of people in a population who have the disease at a given
point in time.
Prevalence proportion ratio – disease prevalence in exposed / disease prevalence in unexposed
Incidence proportion – measures the proportion of people who develop the disease during a specified period
of time.
- aantal mensen dat ziekte oploopt in een bepaalde periode / aantal mensen dat zich in een risicogroep bevindt
voor het oplopen van de ziekte aan het begin van de periode.
Incidence proportion ratio - disease incidence (proportion of new cases) in the exposed group / disease
incidence in the unexposed group
Incidence rate ratio – disease rate in exposed persons / disease rate in unexposed persons
The regression coefficient – describes the linear association between the outcome and the exposure. It
quantifies the expected difference in the outcome per unit difference on the exposure-axis.
Mean difference – the difference between the mean of the outcome measure in the exposed group and the
mean of the outcome measure in the unexposed group. The mean difference is the preferable effect measure
for continuous variables provided certain statistical assumption are met.
STUDY TYPE
Intervention study –
1
, - Designed to test a hypothesized cause-effect relationship by modifying a supposed causal factor in a
population and observing the outcome.
- Characterized by random allocation of exposure
- Characterized by blinding of subjects and investigators with respect to exposure status
Observational study –
- Changes or differences in one characteristic are studied in relation to changes or differences in other
characteristics
- The investigators observe the exposure instead of manipulating it.
STUDY DESIGN
PARALLEL INTERVENTION STUDY
Subjects receive one of two (or more treatments, one of which is being the control treatment. The treatments
are concurrent, the active and control treatments occur in the same period of time. Treatment and control are
allocated to different individuals preferably this happens randomly and blinded
2X2 FACTORIAL DESIGN
when two experimental interventions are not only evaluated separately, but also in combination and against a
control.
PROSPECTIVE COHORT STUDY
Subjects, initially disease free, are followed over a period of time. Some will be exposed to a risk factor and
some won’t. interest is in relating the risk factor to the outcome. Usually cohort studies are large, long term
studies and tend to be costly to carry out
CASE CONTROL STUDY
A study that starts with the identification of persons with the disease (or other outcome variable) of interest,
and a suitable control group of persons that originate from the same source population as the cases. The
association between exposure and outcome is examined by comparing the diseased and non-diseased with
regard to the degree of the exposure. Case-control studies are suitable for studying rare diseases, like specific
forms of cancer.
- In case-control studies an OR is used
- OR = (a*d)/(b*c)
- OR = (p1/ (1-p1)) / (p2/ (1-p2))
- OR = (exposed diseased / exposed healthy) / (non-exposed diseased / non-exposed healthy)
- OR is a suitable estimation of the incidence rate ratio
- OR = odds of disease in exposed group / odds of disease in unexposed group
CROSS-SECTIONAL STUDY
A study that examines the relationship between exposure and outcome as they exist in a defined population at
one particular moment in time. The presence or absence of disease and the presence or absence of the other
variables (or, if they are quantitative, their level) are determined in each member of the study population or in a
representative sample at one particular time.
CROSS-OVER INTERVENTION STUDY
Two or more treatments are applied sequentially to the same subjects; the order of the treatments is
randomized. The advantage is that each subject acts as their own control and so fewer subjects may be
required. The main disadvantage is that there may be a carry-over effect; the action of the second treatment is
affected by the first treatment.
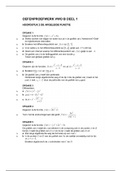
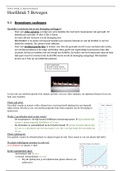
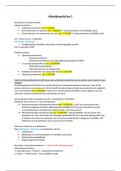
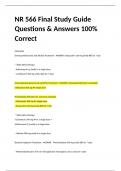
Did investigator assign exposure?
Yes experimental study No observational study
Random allocation? Comparison group?
Yes No Yes No
RCT nRCT analytical study descriptive study
Direction?
Cohort study – exp outc
Case control study – exp outc
Cross-sectional study – exp and outc at the same time
2
– APPLIED
DATA
ANALYSIS
EXTENDED SUMMARY OF THE
LECTURES AND KEY POINTS OF THE
PRACTICALS / E-MODULES
, APPLIED DATA ANALYSIS
1. PRACTICAL SPSS
- A bar chart provides a visual tool for categorical variables.
- A histogram provides a visual tool for continuous variables
- A box plot is a nice tool to visually compare a continuous variables for two or more
groups.
Q1: 25th percentile
Q2: 50th percentile
Q3: 75th percentile
Q2 is the same as the median and since BMI is a continuous variable it’s also the
same as the mean.
2. TEN MODULES
E-MODULES
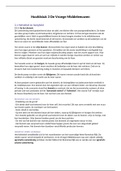
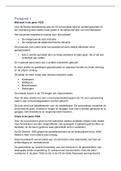
Type of variable Method of data analysis Effect
measure
2 continuous Linear regression β
variables
2 discrete Chi square, logistic OR, IPR, PR, OR case control
variables regression IRR PR cross sectional
IRR prospective cohort
Exposure = Ind. samples, paired Mean Paired samples cross-over trial
discrete samples, ANOVA difference Two-way ANOVA 2x2 factorial
outcome = design
continuous
Exposure = Logistic regression OR, IPR, PR, OR case control most common
continuous IRR one
outcome = PR cross sectional
discrete IRR prospective cohort
EFFECT MEASURE
Prevalence proportion – measures the proportion of people in a population who have the disease at a given
point in time.
Prevalence proportion ratio – disease prevalence in exposed / disease prevalence in unexposed
Incidence proportion – measures the proportion of people who develop the disease during a specified period
of time.
- aantal mensen dat ziekte oploopt in een bepaalde periode / aantal mensen dat zich in een risicogroep bevindt
voor het oplopen van de ziekte aan het begin van de periode.
Incidence proportion ratio - disease incidence (proportion of new cases) in the exposed group / disease
incidence in the unexposed group
Incidence rate ratio – disease rate in exposed persons / disease rate in unexposed persons
The regression coefficient – describes the linear association between the outcome and the exposure. It
quantifies the expected difference in the outcome per unit difference on the exposure-axis.
Mean difference – the difference between the mean of the outcome measure in the exposed group and the
mean of the outcome measure in the unexposed group. The mean difference is the preferable effect measure
for continuous variables provided certain statistical assumption are met.
STUDY TYPE
Intervention study –
1
, - Designed to test a hypothesized cause-effect relationship by modifying a supposed causal factor in a
population and observing the outcome.
- Characterized by random allocation of exposure
- Characterized by blinding of subjects and investigators with respect to exposure status
Observational study –
- Changes or differences in one characteristic are studied in relation to changes or differences in other
characteristics
- The investigators observe the exposure instead of manipulating it.
STUDY DESIGN
PARALLEL INTERVENTION STUDY
Subjects receive one of two (or more treatments, one of which is being the control treatment. The treatments
are concurrent, the active and control treatments occur in the same period of time. Treatment and control are
allocated to different individuals preferably this happens randomly and blinded
2X2 FACTORIAL DESIGN
when two experimental interventions are not only evaluated separately, but also in combination and against a
control.
PROSPECTIVE COHORT STUDY
Subjects, initially disease free, are followed over a period of time. Some will be exposed to a risk factor and
some won’t. interest is in relating the risk factor to the outcome. Usually cohort studies are large, long term
studies and tend to be costly to carry out
CASE CONTROL STUDY
A study that starts with the identification of persons with the disease (or other outcome variable) of interest,
and a suitable control group of persons that originate from the same source population as the cases. The
association between exposure and outcome is examined by comparing the diseased and non-diseased with
regard to the degree of the exposure. Case-control studies are suitable for studying rare diseases, like specific
forms of cancer.
- In case-control studies an OR is used
- OR = (a*d)/(b*c)
- OR = (p1/ (1-p1)) / (p2/ (1-p2))
- OR = (exposed diseased / exposed healthy) / (non-exposed diseased / non-exposed healthy)
- OR is a suitable estimation of the incidence rate ratio
- OR = odds of disease in exposed group / odds of disease in unexposed group
CROSS-SECTIONAL STUDY
A study that examines the relationship between exposure and outcome as they exist in a defined population at
one particular moment in time. The presence or absence of disease and the presence or absence of the other
variables (or, if they are quantitative, their level) are determined in each member of the study population or in a
representative sample at one particular time.
CROSS-OVER INTERVENTION STUDY
Two or more treatments are applied sequentially to the same subjects; the order of the treatments is
randomized. The advantage is that each subject acts as their own control and so fewer subjects may be
required. The main disadvantage is that there may be a carry-over effect; the action of the second treatment is
affected by the first treatment.
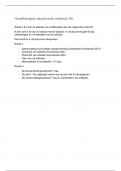
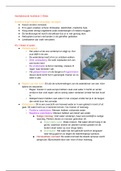
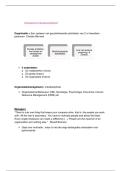
Did investigator assign exposure?
Yes experimental study No observational study
Random allocation? Comparison group?
Yes No Yes No
RCT nRCT analytical study descriptive study
Direction?
Cohort study – exp outc
Case control study – exp outc
Cross-sectional study – exp and outc at the same time
2