Chapter 6 Homework 2 latest update
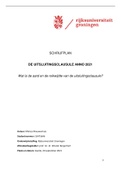
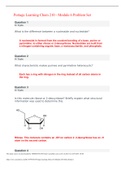
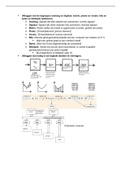
9. A random variable is normally distributed with a mean of μ = 50 and a standard deviation of = 5. σ a. Sketch a normal curve for the probability density function. Label the horizontal axis with values of 35, 40, 45, 50, 55, 60, and 65. Figure 6.4 shows that the normal curve almost touches the horizontal axis at three standard deviations below and at three standard deviations above the mean (in this case at 35 and 65). b. What is the probability the random variable will assume a value between 45 and 55? c. What is the probability the random variable will assume a value between 40 and 60? Figure 6.4 a. b. .683 since 45 and 55 are within plus or minus 1 standard deviation from the mean of 50 (Use the table or see characteristic 7a of the normal distribution). 50 = 5 65 This study source was downloaded by from CourseH on :49:38 GMT -05:0
Geschreven voor
- Instelling
- Northeastern University
- Vak
- BUS 250 (BUS250)
Documentinformatie
- Geüpload op
- 10 mei 2021
- Aantal pagina's
- 5
- Geschreven in
- 2020/2021
- Type
- OVERIG
- Persoon
- Onbekend
Onderwerpen
-
chapter 6 homework 2
-
9 a random variable is normally distributed with a mean of μ 50 and a standard deviation of 5 σ a sketch a normal curve for the probability density function label