Statistics (GEO2-2217) - Assignment 1
Group number 99
Assignment 1
1. Familiarizing with the data and descriptive statistics
Before we can start the testing of the data in our file we first want to get a broad
understanding of the data.
a. How many observations and variables are there in your dataset?
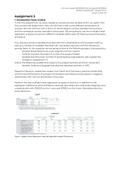
Observations: 170.
Variables: 33.
b. Are there variables that have missing values? If so, which variables? We will now
look into some variables and report several descriptive statistics.
Yes, the following variables have missing values:
- Variable “Leader1” has 8 missing values.
- Variable “Leader2” has 8 missing values.
- Variable “Leader3” has 8 missing values.
- Variable “KnowShare” has 6 missing values.
- Variable “Susknowledge” has 1 missing value.
- Variable “Techsuccess” has 5 missing values.
- Variable “Econsuccess” has 5 missing values.
- Variable “Ecolsuccess” has 5 missing values.
- Variable “OutcomeProduct” has 4 missing values.
- Variable “OutcomeIncome” has 4 missing values.
- Variable “Followup” has 1 missing value.
This data is obtained by using a missing value analysis (Figure 1).
, Figure 1. Missing values analysis
c. The dataset contains various measures of success. We will start working again with
the following measures: variables Techsucces, Econsucces and Ecolsucces.
However, it is not yet clear what combined score of success each project has.
Therefore, we have to create a new variable “Success”. It should reflect the average
success score of the variables Techsuccess, Econsuccess and Ecolsuccess.
i. Create this variable “Success”.
The variable Success is created through: (Techsuccess+Econsuccess+Ecolsuccess)/3
ii. Give and discuss the average, standard deviation and the minimum and
maximum of the variable Success.
The variable Success has the following measurements:
- Average: 6,38
- Standard deviation: 1,771
- Minimum: 1,00
- Maximum: 10,00
This data is obtained by using Descriptive Statistics (Figure 1).
Group number 99
Assignment 1
1. Familiarizing with the data and descriptive statistics
Before we can start the testing of the data in our file we first want to get a broad
understanding of the data.
a. How many observations and variables are there in your dataset?
Observations: 170.
Variables: 33.
b. Are there variables that have missing values? If so, which variables? We will now
look into some variables and report several descriptive statistics.
Yes, the following variables have missing values:
- Variable “Leader1” has 8 missing values.
- Variable “Leader2” has 8 missing values.
- Variable “Leader3” has 8 missing values.
- Variable “KnowShare” has 6 missing values.
- Variable “Susknowledge” has 1 missing value.
- Variable “Techsuccess” has 5 missing values.
- Variable “Econsuccess” has 5 missing values.
- Variable “Ecolsuccess” has 5 missing values.
- Variable “OutcomeProduct” has 4 missing values.
- Variable “OutcomeIncome” has 4 missing values.
- Variable “Followup” has 1 missing value.
This data is obtained by using a missing value analysis (Figure 1).
, Figure 1. Missing values analysis
c. The dataset contains various measures of success. We will start working again with
the following measures: variables Techsucces, Econsucces and Ecolsucces.
However, it is not yet clear what combined score of success each project has.
Therefore, we have to create a new variable “Success”. It should reflect the average
success score of the variables Techsuccess, Econsuccess and Ecolsuccess.
i. Create this variable “Success”.
The variable Success is created through: (Techsuccess+Econsuccess+Ecolsuccess)/3
ii. Give and discuss the average, standard deviation and the minimum and
maximum of the variable Success.
The variable Success has the following measurements:
- Average: 6,38
- Standard deviation: 1,771
- Minimum: 1,00
- Maximum: 10,00
This data is obtained by using Descriptive Statistics (Figure 1).