Page 1 Page 1 of 20 2026-03-07
Introduction to Statistics (Math
110) Simple Random Sampling
Page 1 Page 1 Introduction to Statistics (Math 110) Simple Random Sampling.pdf
, lOMoARcPSD|44532475
Page 2 Page 2 of 20 2026-03-07
We previously defined the following:
1) A population is the set of ALL the elements of interest for a study.
2) A sample is a randomly selected subset of the population.
In order to gain insight about the population, a researcher will use information derived from a
randomly selected sample from the population. The analysis of the information obtained through
this type of research is called statistical inference. Statistical inference allows us to develop
estimates for a population based on the characteristics of the sample.
For example, a home products company may want to determine how well a new detergent is received
by the public. It will not be possible for the company to survey every single customer. That is, the
company cannot survey the entire population. Instead, the company will sample a subset of the
population. It will survey perhaps 100 or 200 people. Based on what the company discovers from this
small sample, it will make “educated guesses” or inferences about what the entire population thinks.
Actually, in statistics we use information obtained from samples to make more than “educated
guesses” about the entire population. We will use very specific calculations in order to make
inferences about the population. These calculations will be developed in the following sections.
5.1: Simple Random
Sampling
A simple random sample is defined as a sample of size n from a population where each possible
sample of size n selected has the same probability of being selected.
Point Estimation
As discussed previously, it is not possible to determine characteristics, such as the mean, of an entire
population, especially when the population is very large. Instead, we develop point estimates for the
population by using statistics from a sample to estimate the value of the corresponding characteristic.
Specifically, we will be using the mean of the sample as an estimate or point estimate of the mean of
the entire population.
Page 2 Page 2 Introduction to Statistics (Math 110) Simple Random Sampling.pdf
Downloaded by madiba South Africa stuvia ()
, lOMoARcPSD|44532475
Page 3 Page 3 of 20 2026-03-07
The most important sample statistic we use is the sample mean, x̄. We use x̄ to estimate the
population mean, μ. For example, suppose that we wish to estimate the average, i.e. the mean, age
of all the cars in a certain city. In order to do this, we decide to check 120 cars and find that the
average age of the 120 cars is 5.3 years, so our sample mean is x̄ = 5.3. We can use this sample
mean to estimate that the mean age of all the cars in the city is μ = 5.3 We will learn later that the
larger the sample size, the better the point estimate x̄ will estimate the population mean μ.
The sample proportion p* is the proportion in the sample. For example, suppose that you wish to
know what proportion of mall shoppers are men. So, you sample 330 people in the mall and find that
160 are men and 170 are women. So, your sample proportion of men that shop at the mall is p* =
160/330 = .485. We can use this to estimate that the proportion of men that shop at the mall is p =
.485.
These are two examples of point estimates. A point estimate is the proper term used when sample
data is used to estimate the value of the characteristic of a population. Therefore, x̄ is the point
estimator of the population mean and the p* is the point estimate of the proportion of a particular
characteristic.
5.2: Sampling
Distribution of x ̅
As already stated, we wish to use a sample mean x̄ to make inferences about the population mean μ.
Repeating the sampling process allows us to develop a sampling distribution for all possible values of
the sample mean x̄. This distribution is called the sampling distribution of the sample mean x̄.
We will now consider some properties of the sampling distribution of x̄, including the expected value
of x̄, the standard deviation of x̄, and the shape of the sampling distribution itself. The knowledge we
gain in this section will provide a basis for making probability statements about the error involved
when using x̄ to estimate μ.
Expected Value of x̄
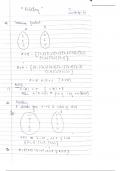
Suppose you have a large population of potatoes that have a mean weight of 8 ounces and a
standard deviation of 1 ounce. Furthermore, the weight of the potatoes is normally distributed.
Suppose you take a sample of 10 potatoes and find the mean weight of the 10. Suppose you take
another sample of 10 potatoes and find the mean weight of those is 10. If you continue to do this, you
might find something like this:
Page 3 Page 3 Introduction to Statistics (Math 110) Simple Random Sampling.pdf
Downloaded by madiba South Africa stuvia ()
Introduction to Statistics (Math
110) Simple Random Sampling
Page 1 Page 1 Introduction to Statistics (Math 110) Simple Random Sampling.pdf
, lOMoARcPSD|44532475
Page 2 Page 2 of 20 2026-03-07
We previously defined the following:
1) A population is the set of ALL the elements of interest for a study.
2) A sample is a randomly selected subset of the population.
In order to gain insight about the population, a researcher will use information derived from a
randomly selected sample from the population. The analysis of the information obtained through
this type of research is called statistical inference. Statistical inference allows us to develop
estimates for a population based on the characteristics of the sample.
For example, a home products company may want to determine how well a new detergent is received
by the public. It will not be possible for the company to survey every single customer. That is, the
company cannot survey the entire population. Instead, the company will sample a subset of the
population. It will survey perhaps 100 or 200 people. Based on what the company discovers from this
small sample, it will make “educated guesses” or inferences about what the entire population thinks.
Actually, in statistics we use information obtained from samples to make more than “educated
guesses” about the entire population. We will use very specific calculations in order to make
inferences about the population. These calculations will be developed in the following sections.
5.1: Simple Random
Sampling
A simple random sample is defined as a sample of size n from a population where each possible
sample of size n selected has the same probability of being selected.
Point Estimation
As discussed previously, it is not possible to determine characteristics, such as the mean, of an entire
population, especially when the population is very large. Instead, we develop point estimates for the
population by using statistics from a sample to estimate the value of the corresponding characteristic.
Specifically, we will be using the mean of the sample as an estimate or point estimate of the mean of
the entire population.
Page 2 Page 2 Introduction to Statistics (Math 110) Simple Random Sampling.pdf
Downloaded by madiba South Africa stuvia ()
, lOMoARcPSD|44532475
Page 3 Page 3 of 20 2026-03-07
The most important sample statistic we use is the sample mean, x̄. We use x̄ to estimate the
population mean, μ. For example, suppose that we wish to estimate the average, i.e. the mean, age
of all the cars in a certain city. In order to do this, we decide to check 120 cars and find that the
average age of the 120 cars is 5.3 years, so our sample mean is x̄ = 5.3. We can use this sample
mean to estimate that the mean age of all the cars in the city is μ = 5.3 We will learn later that the
larger the sample size, the better the point estimate x̄ will estimate the population mean μ.
The sample proportion p* is the proportion in the sample. For example, suppose that you wish to
know what proportion of mall shoppers are men. So, you sample 330 people in the mall and find that
160 are men and 170 are women. So, your sample proportion of men that shop at the mall is p* =
160/330 = .485. We can use this to estimate that the proportion of men that shop at the mall is p =
.485.
These are two examples of point estimates. A point estimate is the proper term used when sample
data is used to estimate the value of the characteristic of a population. Therefore, x̄ is the point
estimator of the population mean and the p* is the point estimate of the proportion of a particular
characteristic.
5.2: Sampling
Distribution of x ̅
As already stated, we wish to use a sample mean x̄ to make inferences about the population mean μ.
Repeating the sampling process allows us to develop a sampling distribution for all possible values of
the sample mean x̄. This distribution is called the sampling distribution of the sample mean x̄.
We will now consider some properties of the sampling distribution of x̄, including the expected value
of x̄, the standard deviation of x̄, and the shape of the sampling distribution itself. The knowledge we
gain in this section will provide a basis for making probability statements about the error involved
when using x̄ to estimate μ.
Expected Value of x̄
Suppose you have a large population of potatoes that have a mean weight of 8 ounces and a
standard deviation of 1 ounce. Furthermore, the weight of the potatoes is normally distributed.
Suppose you take a sample of 10 potatoes and find the mean weight of the 10. Suppose you take
another sample of 10 potatoes and find the mean weight of those is 10. If you continue to do this, you
might find something like this:
Page 3 Page 3 Introduction to Statistics (Math 110) Simple Random Sampling.pdf
Downloaded by madiba South Africa stuvia ()