M&S 3
Airport Modelling and Analysis
M&S 3 – Airport Modelling and Analysis Summary
Week Subjects
Week 1 – o Big Data.
Introduction to Big o Volume, velocity, variety and veracity.
Data and SPSS / o Correlation versus causation.
Data analysis in o Level of measurement.
SPSS. o Descriptive statistics.
o Data analysis methods.
Week 2 – Data - 4 core types of visualization: Relations between data points, Comparison of
Visualization / data points, Composition of data and Distribution of data.
Interpreting Charts - 7 basic rules for making charts and graphs.
- Modern Chart Types: Radar chart, Funnel chart, Gauge chart, Sankey
diagram, and Sunburst diagram.
Week 3 – Linear o Linear Regression
Regression / o Correlation
Assumptions and o Evaluating the model.
Biases o Estimating in SPSS.
Week 4 – Multiple - Multiple Linear Regression
Linear Regression - Data Types
- Enter, Stepwise, Remove, Backward, Forward.
Week 5 – Binary o Logistic Regression
Logistic o Odds (Ratio)
Regression / o Logit
Multinomial o Factors versus Covariates
Logistic Regression o Expected Probabilities
Week 6 – Ordinal - Logistic Regression
Logistic - Factors versus Covariates
Regression / - Linear Regression versus Ordinal Logistic Regression
Dashboarding and - Dashboarding, Grice’s Maxims
Modelling - Data Modelling
Week 7 – Decision o Machine Learning
Tree o Decision Trees
o Parent and Child Node size
Week 8 – Sample - Creating a sample
, M&S 3
Airport Modelling and Analysis
Week 1.1 – Introduction to Big Data and SPSS
Big Data
There is no correct way of describing big data, or a specific amount of data which will make
it ‘big’ or ‘small’. There are however 4 characteristics of big data:
Volume – Scale of data
With volume you can have the problem of having too much, too little or just enough data.
- When you have too little data, your results/graph will spike and it is no trustful
information.
- When having too much data, it is really difficult to see changes, and thus difficult
to interpret.
The right amount is just enough data where your information is trustful and the results are
easy to interpret.
Velocity – Analysis of streaming data
With velocity the analysis of streaming data is considered. Data can be reliable, because it is
monitored in real time. However, if the velocity, so the streaming/updating of the data is not
on spot the real time results are not presented to the researcher at real time. For this reason,
the velocity is of importance.
Variety – Different forms of data
Combine different data sources, both structured and unstructured. Think of structured of
Excel sheets or surveys wit premeditated answers. For unstructured Tweets or surveys with
open questions.
Veracity – Uncertainty of data
Uncertainty of data, there could be missing data, no consequent use of data formats, doubling,
written text, etc. And when you know it is reliable do you use it or not. Is there correlation or
causation?
Correlation versus Causation
Example. More ice cream will lead to more drownings.
However, because of the nice weather (underlying factor), more people will go for a swim,
this will lead to more drownings and more ice cream sales.
So, because of an underlying factor, something will have a certain effect at something else.
But this can be a misunderstanding of the causal relationship between two factors.
- Jumping to an incorrect conclusion about causality (causal relation) when you see
a correlation is the most often made logical mistake.
Causation: one event causes the other event to occur, a causal relation.
Correlation: a statistical relationship between two variables, whether causal or not.
, M&S 3
Airport Modelling and Analysis
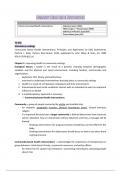
Level of measurement (in SPSS)
Nominal – Mutually exclusive but not ordered in categories.
- No ordering.
- No calculations possible.
- Examples. ID numbers, eye color, gender, red/yellow/blue.
Ordinal – Ordered, but differences between values are not important.
- Values simply express an order.
- Examples. Rankings, movie ratings, low/medium/high.
Interval (scale) – Ordered, constant scale, but no natural zero.
- Differences make sense, but ratios do not.
Difference between 5˚C and 10˚C equals the difference between 45˚C and
50˚C. 0˚C is not a natural zero point.
Note that 50˚C is 5 times 10˚C, which does not make sense.
- Examples. Calendar dates, temperatures in Fahrenheit, temperature in Celsius.
Ratio (scale) – Ordered, constant scale, natural zero (no negative values).
- Examples. Zero on the Kelvin scale is absolute zero. This makes the Kelvin scale
a ratio scale. Other examples: length, time, counts, age.
Week 1.2 – Data analysis in SPSS
Descriptive Statistics
Descriptive statistics summarize the data, for example:
The mean, mode, median and range.
Variance and standard deviation.
Correlation between variables.
Count, maximum and minimum.
Data analysis methods
Correlations To compute the correlation of values between different variables. The
closer to 1.0 the higher the correlation. A negative correlation means
that it is counterintuitive.
Descriptive To compute the mean, standard deviation, etc. of a variable.
Frequencies To compute how many times a certain value appears in the data.
Crosstabs To describe the relationship between two categorical variables.
Compare means To summarize and compare differences in descriptive statistics across
one or more factors, or categorical variables.
Level of measurement
, M&S 3
Airport Modelling and Analysis
Week 2.1 – Data Visualization
Why data visualization?
1. Convince management.
2. Show differences in data, even though the descriptive statistics are the same.
3. Pictures are remembered much better than words.
Choosing the appropriate chart type
There are four core types of visualizations:
1. Relations between data points.
- Relationships charts are used to show a connection or correlation between two or
more variables.
2. Comparison of data points.
- Comparison charts are used to compare one or more datasets. They can compare
items (static) or show differences over time (dynamic).
Static: No change over time. Groups are usually visualized with a radar,
bar chart or clustered column chart.
Dynamic: Time-related data is usually visualized with a line or
column/vertical bar chart.
3. Composition of data.
- Composition charts are used to show how the data is built up from different
elements.
- Often coming from frequency tables.
4. Distribution of data.
- Distribution charts are used to show how variables are distributed over time or
across the dataset. This helps identifying outliers and trends (Single variable or
Multiple variables).
Airport Modelling and Analysis
M&S 3 – Airport Modelling and Analysis Summary
Week Subjects
Week 1 – o Big Data.
Introduction to Big o Volume, velocity, variety and veracity.
Data and SPSS / o Correlation versus causation.
Data analysis in o Level of measurement.
SPSS. o Descriptive statistics.
o Data analysis methods.
Week 2 – Data - 4 core types of visualization: Relations between data points, Comparison of
Visualization / data points, Composition of data and Distribution of data.
Interpreting Charts - 7 basic rules for making charts and graphs.
- Modern Chart Types: Radar chart, Funnel chart, Gauge chart, Sankey
diagram, and Sunburst diagram.
Week 3 – Linear o Linear Regression
Regression / o Correlation
Assumptions and o Evaluating the model.
Biases o Estimating in SPSS.
Week 4 – Multiple - Multiple Linear Regression
Linear Regression - Data Types
- Enter, Stepwise, Remove, Backward, Forward.
Week 5 – Binary o Logistic Regression
Logistic o Odds (Ratio)
Regression / o Logit
Multinomial o Factors versus Covariates
Logistic Regression o Expected Probabilities
Week 6 – Ordinal - Logistic Regression
Logistic - Factors versus Covariates
Regression / - Linear Regression versus Ordinal Logistic Regression
Dashboarding and - Dashboarding, Grice’s Maxims
Modelling - Data Modelling
Week 7 – Decision o Machine Learning
Tree o Decision Trees
o Parent and Child Node size
Week 8 – Sample - Creating a sample
, M&S 3
Airport Modelling and Analysis
Week 1.1 – Introduction to Big Data and SPSS
Big Data
There is no correct way of describing big data, or a specific amount of data which will make
it ‘big’ or ‘small’. There are however 4 characteristics of big data:
Volume – Scale of data
With volume you can have the problem of having too much, too little or just enough data.
- When you have too little data, your results/graph will spike and it is no trustful
information.
- When having too much data, it is really difficult to see changes, and thus difficult
to interpret.
The right amount is just enough data where your information is trustful and the results are
easy to interpret.
Velocity – Analysis of streaming data
With velocity the analysis of streaming data is considered. Data can be reliable, because it is
monitored in real time. However, if the velocity, so the streaming/updating of the data is not
on spot the real time results are not presented to the researcher at real time. For this reason,
the velocity is of importance.
Variety – Different forms of data
Combine different data sources, both structured and unstructured. Think of structured of
Excel sheets or surveys wit premeditated answers. For unstructured Tweets or surveys with
open questions.
Veracity – Uncertainty of data
Uncertainty of data, there could be missing data, no consequent use of data formats, doubling,
written text, etc. And when you know it is reliable do you use it or not. Is there correlation or
causation?
Correlation versus Causation
Example. More ice cream will lead to more drownings.
However, because of the nice weather (underlying factor), more people will go for a swim,
this will lead to more drownings and more ice cream sales.
So, because of an underlying factor, something will have a certain effect at something else.
But this can be a misunderstanding of the causal relationship between two factors.
- Jumping to an incorrect conclusion about causality (causal relation) when you see
a correlation is the most often made logical mistake.
Causation: one event causes the other event to occur, a causal relation.
Correlation: a statistical relationship between two variables, whether causal or not.
, M&S 3
Airport Modelling and Analysis
Level of measurement (in SPSS)
Nominal – Mutually exclusive but not ordered in categories.
- No ordering.
- No calculations possible.
- Examples. ID numbers, eye color, gender, red/yellow/blue.
Ordinal – Ordered, but differences between values are not important.
- Values simply express an order.
- Examples. Rankings, movie ratings, low/medium/high.
Interval (scale) – Ordered, constant scale, but no natural zero.
- Differences make sense, but ratios do not.
Difference between 5˚C and 10˚C equals the difference between 45˚C and
50˚C. 0˚C is not a natural zero point.
Note that 50˚C is 5 times 10˚C, which does not make sense.
- Examples. Calendar dates, temperatures in Fahrenheit, temperature in Celsius.
Ratio (scale) – Ordered, constant scale, natural zero (no negative values).
- Examples. Zero on the Kelvin scale is absolute zero. This makes the Kelvin scale
a ratio scale. Other examples: length, time, counts, age.
Week 1.2 – Data analysis in SPSS
Descriptive Statistics
Descriptive statistics summarize the data, for example:
The mean, mode, median and range.
Variance and standard deviation.
Correlation between variables.
Count, maximum and minimum.
Data analysis methods
Correlations To compute the correlation of values between different variables. The
closer to 1.0 the higher the correlation. A negative correlation means
that it is counterintuitive.
Descriptive To compute the mean, standard deviation, etc. of a variable.
Frequencies To compute how many times a certain value appears in the data.
Crosstabs To describe the relationship between two categorical variables.
Compare means To summarize and compare differences in descriptive statistics across
one or more factors, or categorical variables.
Level of measurement
, M&S 3
Airport Modelling and Analysis
Week 2.1 – Data Visualization
Why data visualization?
1. Convince management.
2. Show differences in data, even though the descriptive statistics are the same.
3. Pictures are remembered much better than words.
Choosing the appropriate chart type
There are four core types of visualizations:
1. Relations between data points.
- Relationships charts are used to show a connection or correlation between two or
more variables.
2. Comparison of data points.
- Comparison charts are used to compare one or more datasets. They can compare
items (static) or show differences over time (dynamic).
Static: No change over time. Groups are usually visualized with a radar,
bar chart or clustered column chart.
Dynamic: Time-related data is usually visualized with a line or
column/vertical bar chart.
3. Composition of data.
- Composition charts are used to show how the data is built up from different
elements.
- Often coming from frequency tables.
4. Distribution of data.
- Distribution charts are used to show how variables are distributed over time or
across the dataset. This helps identifying outliers and trends (Single variable or
Multiple variables).