PREPARED BY
Kathleen Gaillot
BT2103 Research Project
RSM Erasmus University
2020 - 2021
IBA Y2 & Pre-Master IBA
Notes primarily based on Lectures &
Extra Quizzes. Recommended Literature:
Marketing Research by McDaniel & Gates
(10th edition). ISBN: 9781119927150.
Coordinator: Yanick Kuper
Office: Mandeville #17, 9th floor
Phone: 010-408-2624
Email:
Summary & Notes
Research Project 1
,Table of Contents
BLOCK 5: DEFINING THE RESEARCH ................................1 4.1 Cross-Classification Table (Nom/Ord) ................. 20
Part 1: Research ...............................................................1 4.2 Scatter Plots (Int) ................................................. 20
1.1 The Research Process.............................................1 4.3 Covariance (Int) ................................................... 20
1.1.1 Problem vs. Symptom (Step 1) ........................1 4.4 Correlation (Int) ................................................... 21
1.1.2 Research Design (Step 2 & 3) ..........................1 4.5 Hypothesis Testing in One Sample ...................... 22
1.1.3 Follow-Up ........................................................2 4.6 Workshop: Cross Tables & Correlation................ 23
Part 2: Secondary Data (Collecting & Analysing) .............2 4.6.1 Chi-Squared .................................................. 23
2.1 Potential of Online Secondary Data .......................2 4.6.2 Yates’ Continuity Correction ......................... 23
2.1.1 The 4S Framework of Online Big Data ............2 4.6.3 Fisher’s Exact Test......................................... 24
2.2 Exploring Social Media Data ..................................3 4.6.4 Cross Table .................................................... 24
2.3 Workshop A: Qualitative Research ........................3 4.6.5 Correlation .................................................... 25
2.3.1 Ethnography ....................................................3 Part 5: Two-Sample Hypothesis Testing ........................ 26
2.3.2 In-Depth Interviews (IDI) .................................3 5.1 Formulating & Testing Hypotheses ..................... 26
2.3.3 Focus Groups...................................................3 5.1.1 Comparing Means & Independent Samples . 26
2.3.4 Analysing Qualitative Data ..............................4 5.1.2 Comparing Two Population Variances.......... 27
2.4 Survey Research .....................................................4 5.1.3 Difference in 2 Means: Matched Samples .... 28
2.4.1 Constructs & Operationalization.....................4 5.2 ANOVA ................................................................. 29
2.4.2 Levels of Measurement...................................5 5.2.1 Sum of Squares for Treatments & Errors...... 29
2.4.3 Scaling, Reliability & Validity ...........................6 5.2.2 Post-Hoc Comparisons .................................. 31
2.4.4 Tips on Survey Design .....................................7 5.3 Workshop T-Test & ANOVA ................................. 32
2.4.5 Advanced Survey Issues ..................................7 5.3.1 T-Test ............................................................ 32
2.5 Types of Variables: IV & DV....................................7 5.3.2 ANOVA .......................................................... 34
2.5.1 Bivariate: Two Samples ...................................8 5.3.3 Likert Scale .................................................... 35
2.5.2 Overview Statistics & Measurement Level .....8 6. Other .......................................................................... 36
2.5.3 Multivariate Statistics .....................................9 6.1 Symbols Cheat Sheet (and Terminology)............. 36
2.6 Population & Samples ..........................................10 6.2 Frequencies.......................................................... 36
BLOCK 6: SURVEY RESEARCH METHODS ......................11 6.3 Central Limit Theorem ......................................... 37
Part 3: Univariate Analysis Techniques..........................11 6.4 P-Values and Significance Tests ........................... 37
3.1 Descriptive ...........................................................11 6.5. Measurement Levels Extra ................................. 37
3.2 Numerical .............................................................11 6.5.1 Which Visual for Which Level Cheat Sheet ... 38
3.2.1 Probability .....................................................12 7. Quizzes Highlights ...................................................... 38
3.3 Hypothesis Testing ...............................................13 7.1 Exam Practice....................................................... 40
3.3.1 One-Tail & Two-Tail Tests .............................15 BLOCK 7: EXPERIMENTAL METHODS (TBC) .................. 41
3.4 Workshop Hypothesis Testing .............................17
3.4.1 R Outputs ......................................................17
Part 4: Contingency & Correlation .................................19
ii
, Workload (280h total) Block 5 Trimester 1: 3 EC Block 6 Trimester 2: 3 Block 7 Trimester 3: 4
EC EC
Parts X3 (6 hours) X5 (10 hours) X18 (18 hours)
Workshops X3 (6 hours) X5 (10 hours) X8 (16 hours)
Self-Study X6 weeks 8h (48 hours) X6 weeks 6h (36 hours) X6 weeks 8h (48 hours)
Group Report 24 hours (20%) 25 hours (20%) -
Written Test - 3 hours (20%) 3 hours (20%)
Individual Assignment / Presentation - - 27 hours (20%)
Total 84 hours 84 hours 112 hours
BLOCK 5: DEFINING THE RESEARCH
Part 1: Research
Business Research: is about planning, collection, and analysis of data relevant to decision making and the
communication of these results to management. General goal: solve business and societal problems
with various fields of applications such as: market analysis, financial analysis, brand analysis,
product analysis, risk analysis, competitor analysis, demand analysis, distribution analysis.
1.1 The Research Process
8 steps in the Empirical Cycle
1. Identification of the Problem and Statement of the Research Objective distinguish research problem 1.1.1
2. Creation of the Research Design “Types” of research design; primary, secondary,
3. Choice of Method of Research exploratory, descriptive, causal… 1.1.2
4. Selection of the Sampling Procedure
Data collection
5. Collection of the Data
6. Analysis of the Data
7. Writing and Presentation of the Report
8. Follow-up 1.1.3
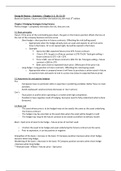
1.1.1 Problem vs. Symptom (Step 1)
How to differentiate a symptom vs a problem?
Symptom: Consequence (that indicates that we have a problem) Problem: What Causes the Symptom
e.g. BMW brand did not attract new customers this year and all the growth came from existing customers
Symptom: Growth Problem: ?
How much did the introduction of the new 3D TV contributed to the sales’ growth for Sony?
Symptom: Sales’ Growth Problem: Introduction new 3D TV
From Decision to Research Problem: How to define a decision problem?
Not too broad: why? Too little guidance to define research problem
o “What branding strategy should we use?” “How shall we use social media?”
Not too narrow and symptom-based: why? Effective solutions might go overlooked
o “Should we increase the price?” “Do people like our new logo?”
Formulating research questions: be specific
- Why/how using PayPal affects online shopping? [too broad, no specific answer]
- Do people who use PayPal shop online more? [answering, but ‘meh’]
- How many more people per year, who have a PayPal account, spend on online shopping [specific]
Decision Problem Research Problem
“What shall we do”? “What information do we need?”
Should Philips invest in designing better 3D TVs? → Are consumers likely to purchase better 3D TVs?
Should ABN AMRO design a new advertising campaign? → How well does the current campaign contribute to sales?
1.1.2 Research Design (Step 2 & 3)
Research characteristics determine research tools.
1
, Primary vs. Secondary data
Secondary Data: data previously gathered Primary Data: new data gathered to solve problem
e.g. reviews, other publications e.g. survey, focus group
Pros: behavioural data, cheap, rapidly available, big sample Pros: the variable you want in your study, up to date
Cons: not the variable you want to study, collection Cons: costly, time consuming, smaller samples
process (web scrapping), biased questions, outdated
Exploratory vs. Descriptive vs. Causal
Exploratory (Qualitative) Descriptive (quantitative) Causal (quantitative)
Main goal: obtaining insights to clarify problems Survey that asks: who, when, Experimental research:
Typical methods: fous group, in-depth where, what, how many, how why
interviews, observations (e.g. etnography) much, how often
1.1.3 Follow-Up
An often neglected aspect of the research process. To check:
Problem formulation? • Suboptimal research method?
Wrong population/sampling? • Bad implementation?
Part 2: Secondary Data (Collecting & Analysing)
2.1 Potential of Online Secondary Data
A variety of sources of secondary data:
1. Data from government and public organizations The internet is omnipresent;
2. Data from private research institutes (e.g., Nielsen) >6h per day spent on average
3. International Publications (WHO) (average American consumer).
4. Press, newspapers, magazines 85% use it every single day.
5. Research scholars (Users as of April 2020)
6. Libraries
7. Internet data
90% of the world’s data was created in the last 2 years. 80% of it is unstructured.
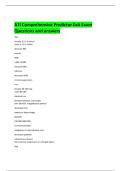
2.1.1 The 4S Framework of Online Big Data
1. Social: Consumers/customers/aficionados/detractors. Emotions, brand image, conversations. Public
2. Shop: Alibaba, Amazon, Sephora…
Prospect & clients – brand attractiveness
3. Site: (Corporate), BBC, Vogue, Newspaper
4. Search: Google, Yandex: everyone. consideration set, semantic association, interest Consumer Journey Start
Consumer insights can be quantitative (looking at trends), and qualitative (looking at video content etc.)
2
Kathleen Gaillot
BT2103 Research Project
RSM Erasmus University
2020 - 2021
IBA Y2 & Pre-Master IBA
Notes primarily based on Lectures &
Extra Quizzes. Recommended Literature:
Marketing Research by McDaniel & Gates
(10th edition). ISBN: 9781119927150.
Coordinator: Yanick Kuper
Office: Mandeville #17, 9th floor
Phone: 010-408-2624
Email:
Summary & Notes
Research Project 1
,Table of Contents
BLOCK 5: DEFINING THE RESEARCH ................................1 4.1 Cross-Classification Table (Nom/Ord) ................. 20
Part 1: Research ...............................................................1 4.2 Scatter Plots (Int) ................................................. 20
1.1 The Research Process.............................................1 4.3 Covariance (Int) ................................................... 20
1.1.1 Problem vs. Symptom (Step 1) ........................1 4.4 Correlation (Int) ................................................... 21
1.1.2 Research Design (Step 2 & 3) ..........................1 4.5 Hypothesis Testing in One Sample ...................... 22
1.1.3 Follow-Up ........................................................2 4.6 Workshop: Cross Tables & Correlation................ 23
Part 2: Secondary Data (Collecting & Analysing) .............2 4.6.1 Chi-Squared .................................................. 23
2.1 Potential of Online Secondary Data .......................2 4.6.2 Yates’ Continuity Correction ......................... 23
2.1.1 The 4S Framework of Online Big Data ............2 4.6.3 Fisher’s Exact Test......................................... 24
2.2 Exploring Social Media Data ..................................3 4.6.4 Cross Table .................................................... 24
2.3 Workshop A: Qualitative Research ........................3 4.6.5 Correlation .................................................... 25
2.3.1 Ethnography ....................................................3 Part 5: Two-Sample Hypothesis Testing ........................ 26
2.3.2 In-Depth Interviews (IDI) .................................3 5.1 Formulating & Testing Hypotheses ..................... 26
2.3.3 Focus Groups...................................................3 5.1.1 Comparing Means & Independent Samples . 26
2.3.4 Analysing Qualitative Data ..............................4 5.1.2 Comparing Two Population Variances.......... 27
2.4 Survey Research .....................................................4 5.1.3 Difference in 2 Means: Matched Samples .... 28
2.4.1 Constructs & Operationalization.....................4 5.2 ANOVA ................................................................. 29
2.4.2 Levels of Measurement...................................5 5.2.1 Sum of Squares for Treatments & Errors...... 29
2.4.3 Scaling, Reliability & Validity ...........................6 5.2.2 Post-Hoc Comparisons .................................. 31
2.4.4 Tips on Survey Design .....................................7 5.3 Workshop T-Test & ANOVA ................................. 32
2.4.5 Advanced Survey Issues ..................................7 5.3.1 T-Test ............................................................ 32
2.5 Types of Variables: IV & DV....................................7 5.3.2 ANOVA .......................................................... 34
2.5.1 Bivariate: Two Samples ...................................8 5.3.3 Likert Scale .................................................... 35
2.5.2 Overview Statistics & Measurement Level .....8 6. Other .......................................................................... 36
2.5.3 Multivariate Statistics .....................................9 6.1 Symbols Cheat Sheet (and Terminology)............. 36
2.6 Population & Samples ..........................................10 6.2 Frequencies.......................................................... 36
BLOCK 6: SURVEY RESEARCH METHODS ......................11 6.3 Central Limit Theorem ......................................... 37
Part 3: Univariate Analysis Techniques..........................11 6.4 P-Values and Significance Tests ........................... 37
3.1 Descriptive ...........................................................11 6.5. Measurement Levels Extra ................................. 37
3.2 Numerical .............................................................11 6.5.1 Which Visual for Which Level Cheat Sheet ... 38
3.2.1 Probability .....................................................12 7. Quizzes Highlights ...................................................... 38
3.3 Hypothesis Testing ...............................................13 7.1 Exam Practice....................................................... 40
3.3.1 One-Tail & Two-Tail Tests .............................15 BLOCK 7: EXPERIMENTAL METHODS (TBC) .................. 41
3.4 Workshop Hypothesis Testing .............................17
3.4.1 R Outputs ......................................................17
Part 4: Contingency & Correlation .................................19
ii
, Workload (280h total) Block 5 Trimester 1: 3 EC Block 6 Trimester 2: 3 Block 7 Trimester 3: 4
EC EC
Parts X3 (6 hours) X5 (10 hours) X18 (18 hours)
Workshops X3 (6 hours) X5 (10 hours) X8 (16 hours)
Self-Study X6 weeks 8h (48 hours) X6 weeks 6h (36 hours) X6 weeks 8h (48 hours)
Group Report 24 hours (20%) 25 hours (20%) -
Written Test - 3 hours (20%) 3 hours (20%)
Individual Assignment / Presentation - - 27 hours (20%)
Total 84 hours 84 hours 112 hours
BLOCK 5: DEFINING THE RESEARCH
Part 1: Research
Business Research: is about planning, collection, and analysis of data relevant to decision making and the
communication of these results to management. General goal: solve business and societal problems
with various fields of applications such as: market analysis, financial analysis, brand analysis,
product analysis, risk analysis, competitor analysis, demand analysis, distribution analysis.
1.1 The Research Process
8 steps in the Empirical Cycle
1. Identification of the Problem and Statement of the Research Objective distinguish research problem 1.1.1
2. Creation of the Research Design “Types” of research design; primary, secondary,
3. Choice of Method of Research exploratory, descriptive, causal… 1.1.2
4. Selection of the Sampling Procedure
Data collection
5. Collection of the Data
6. Analysis of the Data
7. Writing and Presentation of the Report
8. Follow-up 1.1.3
1.1.1 Problem vs. Symptom (Step 1)
How to differentiate a symptom vs a problem?
Symptom: Consequence (that indicates that we have a problem) Problem: What Causes the Symptom
e.g. BMW brand did not attract new customers this year and all the growth came from existing customers
Symptom: Growth Problem: ?
How much did the introduction of the new 3D TV contributed to the sales’ growth for Sony?
Symptom: Sales’ Growth Problem: Introduction new 3D TV
From Decision to Research Problem: How to define a decision problem?
Not too broad: why? Too little guidance to define research problem
o “What branding strategy should we use?” “How shall we use social media?”
Not too narrow and symptom-based: why? Effective solutions might go overlooked
o “Should we increase the price?” “Do people like our new logo?”
Formulating research questions: be specific
- Why/how using PayPal affects online shopping? [too broad, no specific answer]
- Do people who use PayPal shop online more? [answering, but ‘meh’]
- How many more people per year, who have a PayPal account, spend on online shopping [specific]
Decision Problem Research Problem
“What shall we do”? “What information do we need?”
Should Philips invest in designing better 3D TVs? → Are consumers likely to purchase better 3D TVs?
Should ABN AMRO design a new advertising campaign? → How well does the current campaign contribute to sales?
1.1.2 Research Design (Step 2 & 3)
Research characteristics determine research tools.
1
, Primary vs. Secondary data
Secondary Data: data previously gathered Primary Data: new data gathered to solve problem
e.g. reviews, other publications e.g. survey, focus group
Pros: behavioural data, cheap, rapidly available, big sample Pros: the variable you want in your study, up to date
Cons: not the variable you want to study, collection Cons: costly, time consuming, smaller samples
process (web scrapping), biased questions, outdated
Exploratory vs. Descriptive vs. Causal
Exploratory (Qualitative) Descriptive (quantitative) Causal (quantitative)
Main goal: obtaining insights to clarify problems Survey that asks: who, when, Experimental research:
Typical methods: fous group, in-depth where, what, how many, how why
interviews, observations (e.g. etnography) much, how often
1.1.3 Follow-Up
An often neglected aspect of the research process. To check:
Problem formulation? • Suboptimal research method?
Wrong population/sampling? • Bad implementation?
Part 2: Secondary Data (Collecting & Analysing)
2.1 Potential of Online Secondary Data
A variety of sources of secondary data:
1. Data from government and public organizations The internet is omnipresent;
2. Data from private research institutes (e.g., Nielsen) >6h per day spent on average
3. International Publications (WHO) (average American consumer).
4. Press, newspapers, magazines 85% use it every single day.
5. Research scholars (Users as of April 2020)
6. Libraries
7. Internet data
90% of the world’s data was created in the last 2 years. 80% of it is unstructured.
2.1.1 The 4S Framework of Online Big Data
1. Social: Consumers/customers/aficionados/detractors. Emotions, brand image, conversations. Public
2. Shop: Alibaba, Amazon, Sephora…
Prospect & clients – brand attractiveness
3. Site: (Corporate), BBC, Vogue, Newspaper
4. Search: Google, Yandex: everyone. consideration set, semantic association, interest Consumer Journey Start
Consumer insights can be quantitative (looking at trends), and qualitative (looking at video content etc.)
2