2024-
2025
WPO
STATISTIEK 4: MDA
IREM SOGUKPINAR
VRIJE UNIVERSITEIT BRUSSEL
,2024-2025
1
, 2024-2025
WPO 1
Oefening 1: Zoek op hoe je een csv bestand inleest en importeer het bestand.
A.Lees de data in
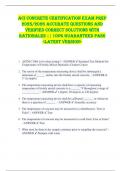
Tekst editor:
DATA IMPORTEREN
1. Open SPSS
2. File → Open → Data
3. Selecteer CSV data en open het bestand
4. Tekst Import Wizard:
- Stap 1: "No" kiezen bij predefined format → continue
- Stap 2: "Delimited" selecteren, "Yes" bij variable names, “Period” → continue
- Stap 3: Line 2 voor eerste data, "All cases" → continue
- Stap 4: "Comma" als scheidingsteken, "Double quote" als tekstdefinitie → remove leading
+ trailing aanvinken → continue
- Stap 5: Shift indrukken hap_2005 t.e.m. hap_2023 → numeric → continue
- Stap 6: "No" bij save format, "Yes" bij paste syntax → done
5. Syntax -> alles selecteren → play
6. File → save as → document naam geven → bureaublad → save
2
, 2024-2025
Oefening 2: Zet de bevolkingsgrootte (pop_2023) om naar een numerieke variabele (M =
millioen, k = duizend).
A.Transformeer de variabele zoals hierboven beschreven.
STAP 1:
1. Syntax → schrijf
STRING pop_komma (A8).
EXECUTE.
→ Play → Play
2. Transform → Compute variable → Target variable: pop_komma → Functions and
Special variables: REPLACE3 → Numeric expression: REPLACE (pop_2023, “.”,”,”) →
Paste → Ok → Play.
3. Transform → Compute variable → Target variable: pop_value → Function group:
conversion → Functions and special variables: number → pijl klikken → Function
group:all → Functions and special variables: char.subst2 → pijl klikken → Numeric
expression= NUMBER (CHAR.SUBSTR (pop_komma, 1, Length (pop_komma)-1), F8.0)
→ Paste → Ok → Play
4. Transform → Compute variable → Target variable: pop_value → Function group →
conversion → functions… number kiezen → pijl klikken → Function group → all →
functions… char.subst2 kiezen → pijl klikken → Numeric expression= NUMBER
(CHAR.SUBSTR (pop_2023, 1, Length (pop_2023)-1), F8.0) → Paste → Play
3
, 2024-2025
NIEUWE VARIABELE MAKEN (2 manieren)
1. Open syntax → schrijf handmatig
Uw variabele formule.
EXECUTE.
→ play → alle syntax selecteren → play
2. Variable view → helemaal onderaan lege rij → uw variabele schrijven → type: string → width:
8 → data view
STAP 2:
1. Syntax → schrijf
STRING pop_letter (A8).
EXECUTE.
Play → variable view
2. Transform → Compute variable → Target variable: pop_letter → Function group: all →
Functions and special variables: char. Subst2 → pijl klikken → Numeric expression=
CHAR.SUBSTR (pop_2023, Length (pop_2023),1) → Paste → Ok → Play
STAP 3:
Syntax → bovenstaande info handmatig invullen → paste → play
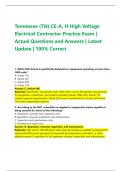
B. Geef de totale bevolking weer per continent (world_4region)
Data → Split file → Compare groups + Sort the file by grouping variables aanduiden→ Groups
based on: world_4region → Paste → Play
4
, 2024-2025
Hier heb je geen output van!!
Analyze → Descriptive statistics → Descriptives → Variable(s): pop_numeric → Options → Sum
aanduiden → Continue → Paste → Play
SPLIT FILE UITZETTEN
Data → Split file → Analyze all cases, do not creatie groups → Paste → Play
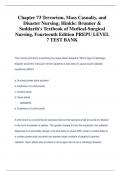
C. Welke godsdienst heeft de meeste aanhangers? Bereken dit via de totale populatie per
godsdienst en plot dit in een gepaste grafiek.
Data → Split file → Compare groups + Sort the file by grouping variables aanduiden → Groups
based on: main_religion_2008 → Paste → Play
Analyze → Descriptive statistics → Descriptives → Variable(s): pop_numeric → Options → Sum
aanvinken → Continue → Paste → Play
PAS OP: je zou makkelijk kunnen denken
dat de oosterse religies het meeste
voorkomen maar dat is niet zo
ð Hoe kan je dit makkelijk zien?
Eerst moet je dubbelklikken op de tabel
in de output dan wordt je gebracht naar
een ander venster waar je meer kan
veranderen. Als je nu dubbelklikt op de
cijfers dan krijg je op de correcte plaatsen
punten staan. Dit moet je echter doen
getal per getal.
SPLIT FILE UITZETTEN
Data → Split file → Analyze all cases, do not create groups → Paste → Play
5
2025
WPO
STATISTIEK 4: MDA
IREM SOGUKPINAR
VRIJE UNIVERSITEIT BRUSSEL
,2024-2025
1
, 2024-2025
WPO 1
Oefening 1: Zoek op hoe je een csv bestand inleest en importeer het bestand.
A.Lees de data in
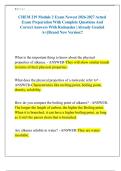
Tekst editor:
DATA IMPORTEREN
1. Open SPSS
2. File → Open → Data
3. Selecteer CSV data en open het bestand
4. Tekst Import Wizard:
- Stap 1: "No" kiezen bij predefined format → continue
- Stap 2: "Delimited" selecteren, "Yes" bij variable names, “Period” → continue
- Stap 3: Line 2 voor eerste data, "All cases" → continue
- Stap 4: "Comma" als scheidingsteken, "Double quote" als tekstdefinitie → remove leading
+ trailing aanvinken → continue
- Stap 5: Shift indrukken hap_2005 t.e.m. hap_2023 → numeric → continue
- Stap 6: "No" bij save format, "Yes" bij paste syntax → done
5. Syntax -> alles selecteren → play
6. File → save as → document naam geven → bureaublad → save
2
, 2024-2025
Oefening 2: Zet de bevolkingsgrootte (pop_2023) om naar een numerieke variabele (M =
millioen, k = duizend).
A.Transformeer de variabele zoals hierboven beschreven.
STAP 1:
1. Syntax → schrijf
STRING pop_komma (A8).
EXECUTE.
→ Play → Play
2. Transform → Compute variable → Target variable: pop_komma → Functions and
Special variables: REPLACE3 → Numeric expression: REPLACE (pop_2023, “.”,”,”) →
Paste → Ok → Play.
3. Transform → Compute variable → Target variable: pop_value → Function group:
conversion → Functions and special variables: number → pijl klikken → Function
group:all → Functions and special variables: char.subst2 → pijl klikken → Numeric
expression= NUMBER (CHAR.SUBSTR (pop_komma, 1, Length (pop_komma)-1), F8.0)
→ Paste → Ok → Play
4. Transform → Compute variable → Target variable: pop_value → Function group →
conversion → functions… number kiezen → pijl klikken → Function group → all →
functions… char.subst2 kiezen → pijl klikken → Numeric expression= NUMBER
(CHAR.SUBSTR (pop_2023, 1, Length (pop_2023)-1), F8.0) → Paste → Play
3
, 2024-2025
NIEUWE VARIABELE MAKEN (2 manieren)
1. Open syntax → schrijf handmatig
Uw variabele formule.
EXECUTE.
→ play → alle syntax selecteren → play
2. Variable view → helemaal onderaan lege rij → uw variabele schrijven → type: string → width:
8 → data view
STAP 2:
1. Syntax → schrijf
STRING pop_letter (A8).
EXECUTE.
Play → variable view
2. Transform → Compute variable → Target variable: pop_letter → Function group: all →
Functions and special variables: char. Subst2 → pijl klikken → Numeric expression=
CHAR.SUBSTR (pop_2023, Length (pop_2023),1) → Paste → Ok → Play
STAP 3:
Syntax → bovenstaande info handmatig invullen → paste → play
B. Geef de totale bevolking weer per continent (world_4region)
Data → Split file → Compare groups + Sort the file by grouping variables aanduiden→ Groups
based on: world_4region → Paste → Play
4
, 2024-2025
Hier heb je geen output van!!
Analyze → Descriptive statistics → Descriptives → Variable(s): pop_numeric → Options → Sum
aanduiden → Continue → Paste → Play
SPLIT FILE UITZETTEN
Data → Split file → Analyze all cases, do not creatie groups → Paste → Play
C. Welke godsdienst heeft de meeste aanhangers? Bereken dit via de totale populatie per
godsdienst en plot dit in een gepaste grafiek.
Data → Split file → Compare groups + Sort the file by grouping variables aanduiden → Groups
based on: main_religion_2008 → Paste → Play
Analyze → Descriptive statistics → Descriptives → Variable(s): pop_numeric → Options → Sum
aanvinken → Continue → Paste → Play
PAS OP: je zou makkelijk kunnen denken
dat de oosterse religies het meeste
voorkomen maar dat is niet zo
ð Hoe kan je dit makkelijk zien?
Eerst moet je dubbelklikken op de tabel
in de output dan wordt je gebracht naar
een ander venster waar je meer kan
veranderen. Als je nu dubbelklikt op de
cijfers dan krijg je op de correcte plaatsen
punten staan. Dit moet je echter doen
getal per getal.
SPLIT FILE UITZETTEN
Data → Split file → Analyze all cases, do not create groups → Paste → Play
5